3 min read
A Year with "The Trading Mindwheel": Transforming Trading Through Psychology
The following is a guest post from Michael Lamothe.
I'm Michael Lamothe, and today marks an extraordinary milestone: the first anniversary of "The...

Understanding and evaluating trading and system performance correctly and avoiding costly mistakes is very important. Although most traders do not fully understand how to interpret trading results and risk properly, this can be overcome very easily.
The expectancy provides information about how much money you will make on average per single trade. To calculate expectancy, you need to know the winrate, the reward:risk ratio and the average position size. The formula is the following:
Expectancy = [Winrate * Reward:Risk * Poition Size] – [(1-Winrate) * Position Size]
For a trading strategy with a winrate of 55%, an average reward:risk ratio of 1.5 and an average position size of 2%, this is what the expectancy looks like:
Expectancy = [ 55% * 1.5 * 2% ] – [(1-55%) * 2%] = 0.75%
This means that a trading strategy with these parameters has an expectancy of 0.75% and, over the long-term, each trade is ‘worth’ 0.75%
2) Risk of Ruin
The risk of ruin statistic is very important to evaluate the importance of account swings and drawdowns. The risk of ruin states how likely it is, based on performance metrics such as expectancy and account volatility, that a trading method loses all money, or a significant point.
The lower the expectancy of a trading system and the higher the swings of a trading method, the higher the risk of ruin.
https://www.youtube.com/watch?v=Bgoe_kk3Pt0
The recovery rate tells you how much return you have to achieve to recover the losses and get back to the point of break-even. The recovery rate either uses the highest point of the equity, or the starting point.
| Starting account balance 10,000 | ||
| Current account balance | %-Loss from starting point | Recovery Rate |
| 9,000 | 10% | 11% |
| 8,000 | 20% | 25% |
| 7,000 | 30% | 43% |
| 6,000 | 40% | 67% |
| 5,000 | 50% | 100% |
| 4,000 | 60% | 150% |
| 3,000 | 70% | 233% |
| 2,000 | 80% | 400% |
| 1,000 | 90% | 900% |
| 100 | 99% | 9900% |
The two following equity graphs show two different trading methods with different parameters for winrate, expectancy and position size. Both strategies have realized positive returns, shown by the steadily rising equity graphs and both have the same return of 72%, but as you can see at first glance, the performance in between the starting point and the point to the most right are very different and the drawdowns and the way the account growths differ significantly. Keep in mind, drawdowns and risk can impact trading decisions significantly and often cause traders to make impulsive trading decisions.
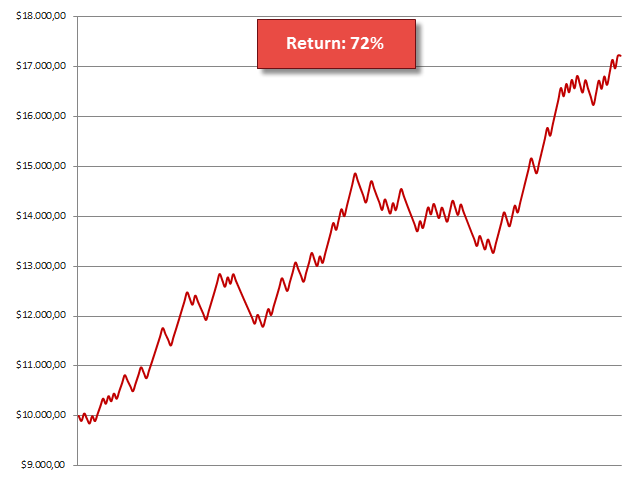
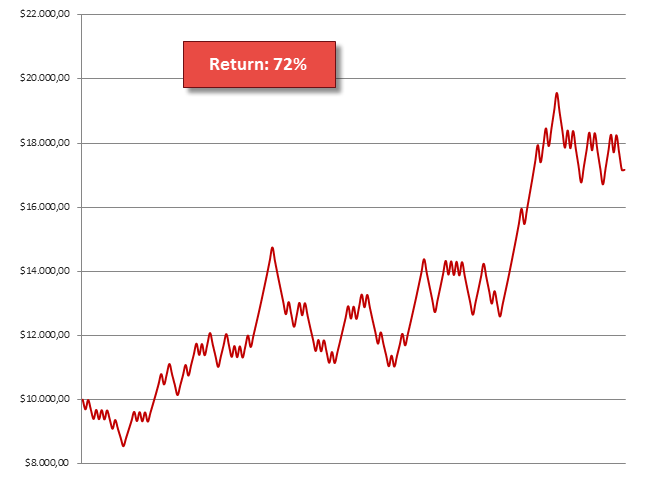
Measuring performance in percentages alone can be very misleading because it does not give any information about the size, the frequency and the significance of drawdowns and the risk of a trading strategy.
The Sharpe ratio is a very popular performance metric and it is used very commonly by investors, traders and everywhere in the financial world. The advantage of the Sharpe ratio is that it also analyzes the risk of a trading method and that it provided information about the volatility of account growth.
It is important to know that the higher a Sharpe ratio of a trading method, the better the return a trader can expect in relation to the possible risk and the size and frequency of drawdowns.
Furthermore, when comparing two trading methods with the same percentage return, the one with the higher Sharpe ratio has had less account volatility in the past and a smoother growth.
A risk averse trader should look for ways to minimize the Sharpe ratio of his trading method to avoid significant account swings. Most social trading websites or EAs always provide the Sharpe ratio of their strategy. Knowing how to interpret this figure correctly can help you choose the best fit for your personality and the level of risk you are willing to take.
The Sortino ratio is a modification and an advancement of the Sharpe ratio. The Sharpe ratio penalizes both, unusually high positive and unusually high negative return and views them as equally bad. Obviously, it makes sense to only penalize negative returns and this is where to Sortino ratio has its advantages. It only penalizes downside risk (negative volatility), which means that when a trading strategy realizes exceptionally high positive returns, the Sortino ratio does not penalize the trading strategy.
If you can choose between the Sortino and the Sharpe Ratio, the Sortio ratio provides more information about the risk of a trading strategy. And even though two methods could have the same Sharpe ratio, the Sortino ratios could differ significantly.


external link:
external link:

3 min read
The following is a guest post from Michael Lamothe.
I'm Michael Lamothe, and today marks an extraordinary milestone: the first anniversary of "The...
3 min read
It's easy to get discouraged by losses and question your every move. But what if there was a way to track your progress, learn from mistakes, and...

8 min read
Dive deep into the world of finance and high-stakes trading with this selection of movies and documentaries! From the exhilarating thrill of...