
Supply and Demand Trading in 2026
We have been trading supply and demand strategies for over ten years, and they have stood the test of time remarkably well. Supply and demand is...
Multi-timeframe trading describes a trading approach where the trader combines different trading timeframes to improve decision-making and optimize their chart analyses.
The goal of multi-timeframe trading is to enhance the profit profile of individual trades by trading long-term signals in a short-term timeframe. We´ll explain what this means with concrete examples in the following article.
Typically, traders make use of one so-called higher timeframe and one lower timeframe. The higher timeframe is used to analyze the longer-term chart and trend context to get a general sense of market direction and sentiment. Traders try to establish a directional bias (long, short, or neutral) on the higher timeframe and then look for specific trading opportunities in the higher timeframe direction on their lower timeframes. The lower timeframe is hereby used to time entries and manage trading positions.
One of the biggest mistakes traders make when performing a multi-timeframe analysis is that they start their analysis on the lower time frames and then work their way up to the higher time frames. This would be called a bottom-up approach.
Starting your analysis on your lower timeframe where you look for trading signals creates a very narrow and one-dimensional view. The danger is that traders find a trade signal on their lower timeframe and, (1) either forget to check the higher timeframe and then trade against their higher timeframe, or (2) manipulate their higher timeframe analysis so that it fits their lower timeframe signal, ignoring important signals on the higher timeframe.

For those reasons, we recommend the top-down method. With a top-down approach, a trader starts their analysis on the higher timeframe to get a general sense of the market sentiment, the general trend context, and becomes aware of important price hurdles and key levels. On the lower timeframe, the trader then looks for trading opportunities based on the higher timeframe perspective. The trade then fits perfectly into the overall chart narrative.
The first question that always comes up when getting into multi-timeframe trading is which timeframes to use. I recommend keeping it simple, especially in the beginning, and limiting it to two timeframes that you use in your trading.
Higher timeframe |
Lower timeframe |
Trading style |
| Weekly | Daily or 4H | Swing trading |
| Daily | 4H or 1H | Shorter-term swing trading |
| Daily | 30min or 15min | Intra-day trading |
| 4H | 30min or 15min | Fast-paced intra-day trading |
| 1H | 15min or 5min | Classic day-trading |
| 1H | 5min or 1 min | Fast-paced day-trading / Scalping |
The table above shows the most common timeframe combinations. To improve the consistency in your trading approach, I recommend picking one combination and sticking to it for an extended period. This way, you can gain experience with the specified timeframe combination and see if it is the right fit for your trading.
Avoid jumping around between timeframe combinations because it creates inconsistencies in your trading and introduces noise.
Stay with one timeframe combination for at least 30 to 50 trades before changing timeframes.
Now that you have settled on a timeframe combination, we explore how the higher and lower timeframes are used together.
First, you need to be clear about what you are specifically looking for in your higher timeframe.
Here, traders can choose from a variety of different higher timeframe "cues" (or so-called confluence factors). Depending on your preferred chart analysis approach, you can choose the right signals for your own multi-timeframe strategy.
In the following, I list a few confluence factors that are typical for a higher timeframe approach:
One of the most commonly used higher timeframe concepts is one of support and resistance levels. Traders who make use of support and resistance levels on the higher timeframe typically either look for a bounce or a break of a long-term horizontal level.
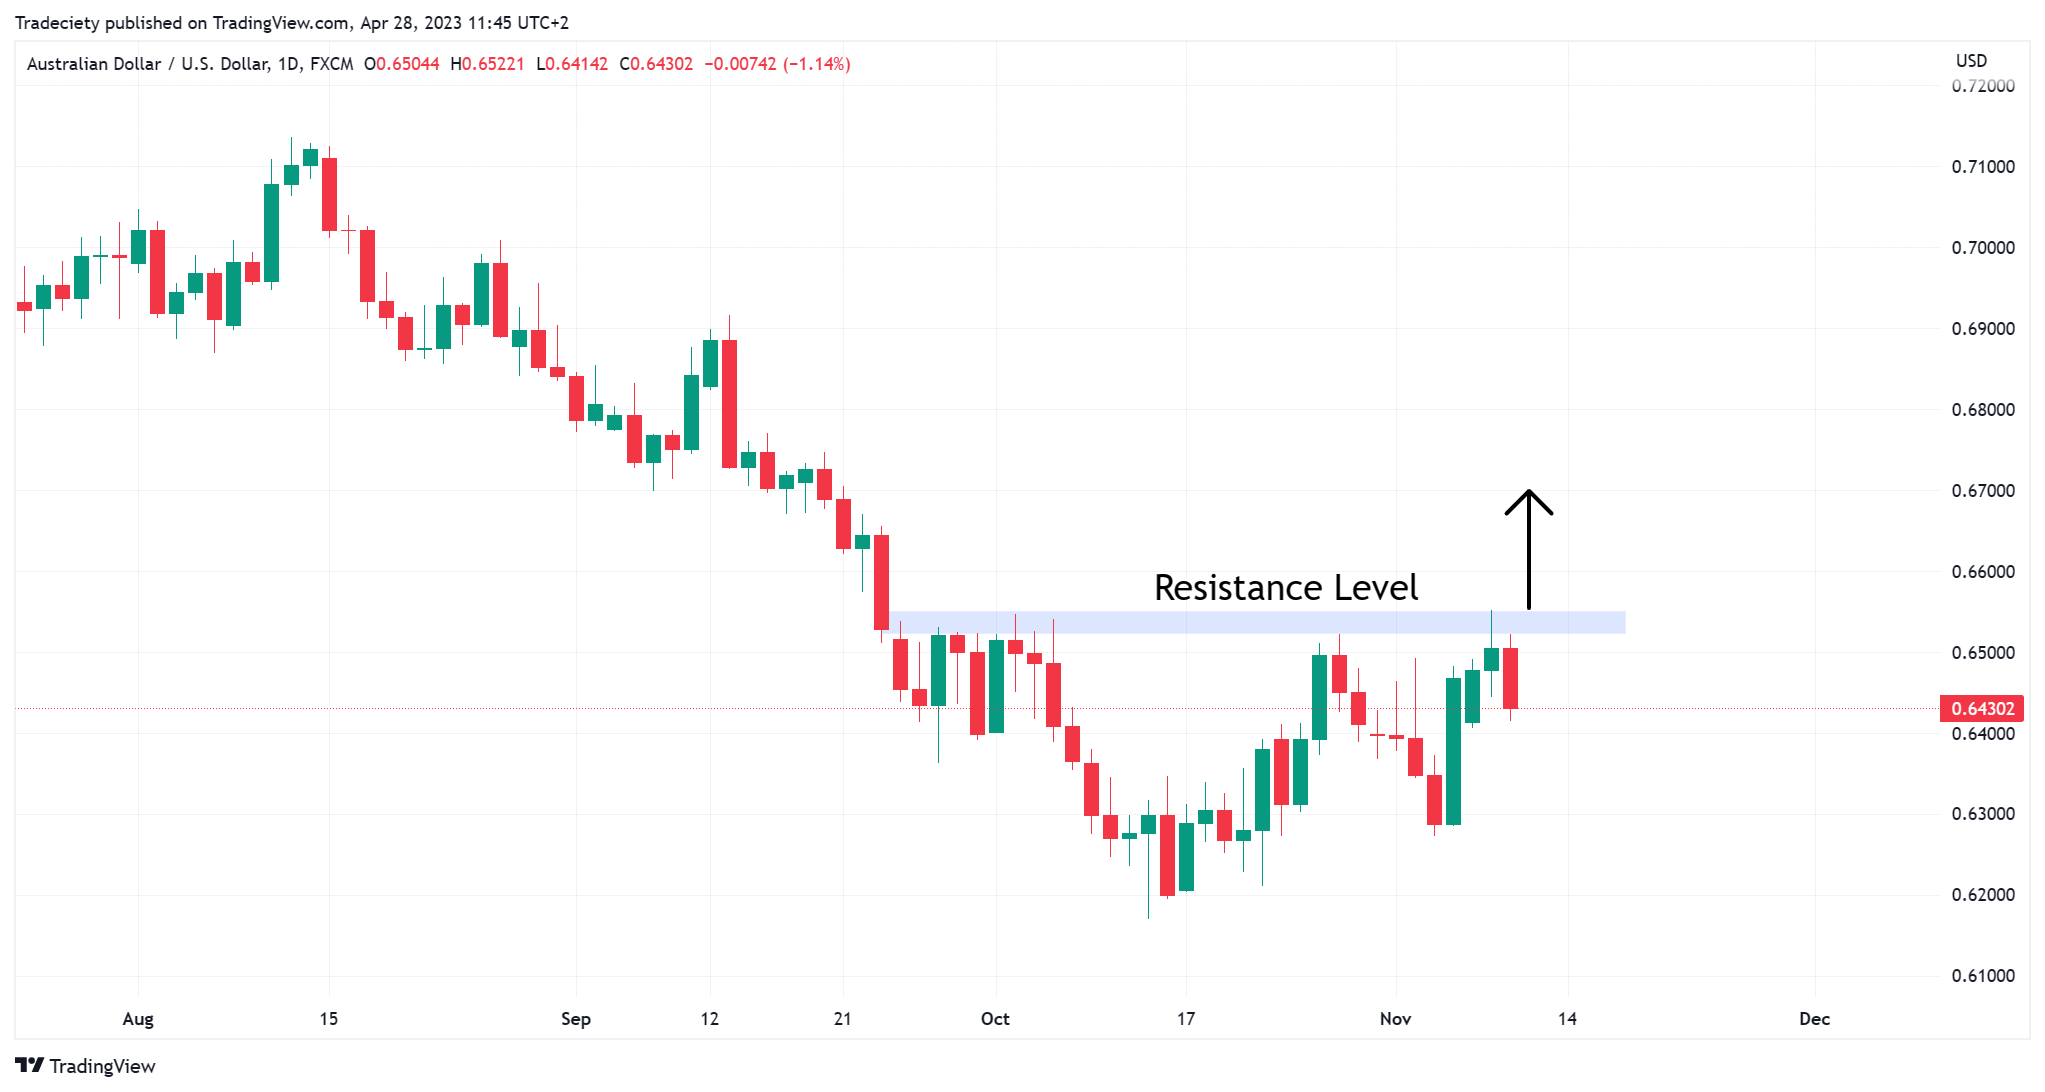
The image below shows the Daily timeframe level with a strong resistance level marked. The trader identifies the level on their higher timeframe and after the break, he goes to his lower timeframe to look for trading bullish opportunities.
Higher timeframe support and resistance levels carry more importance which is why you should always look for your levels on your higher timeframe.
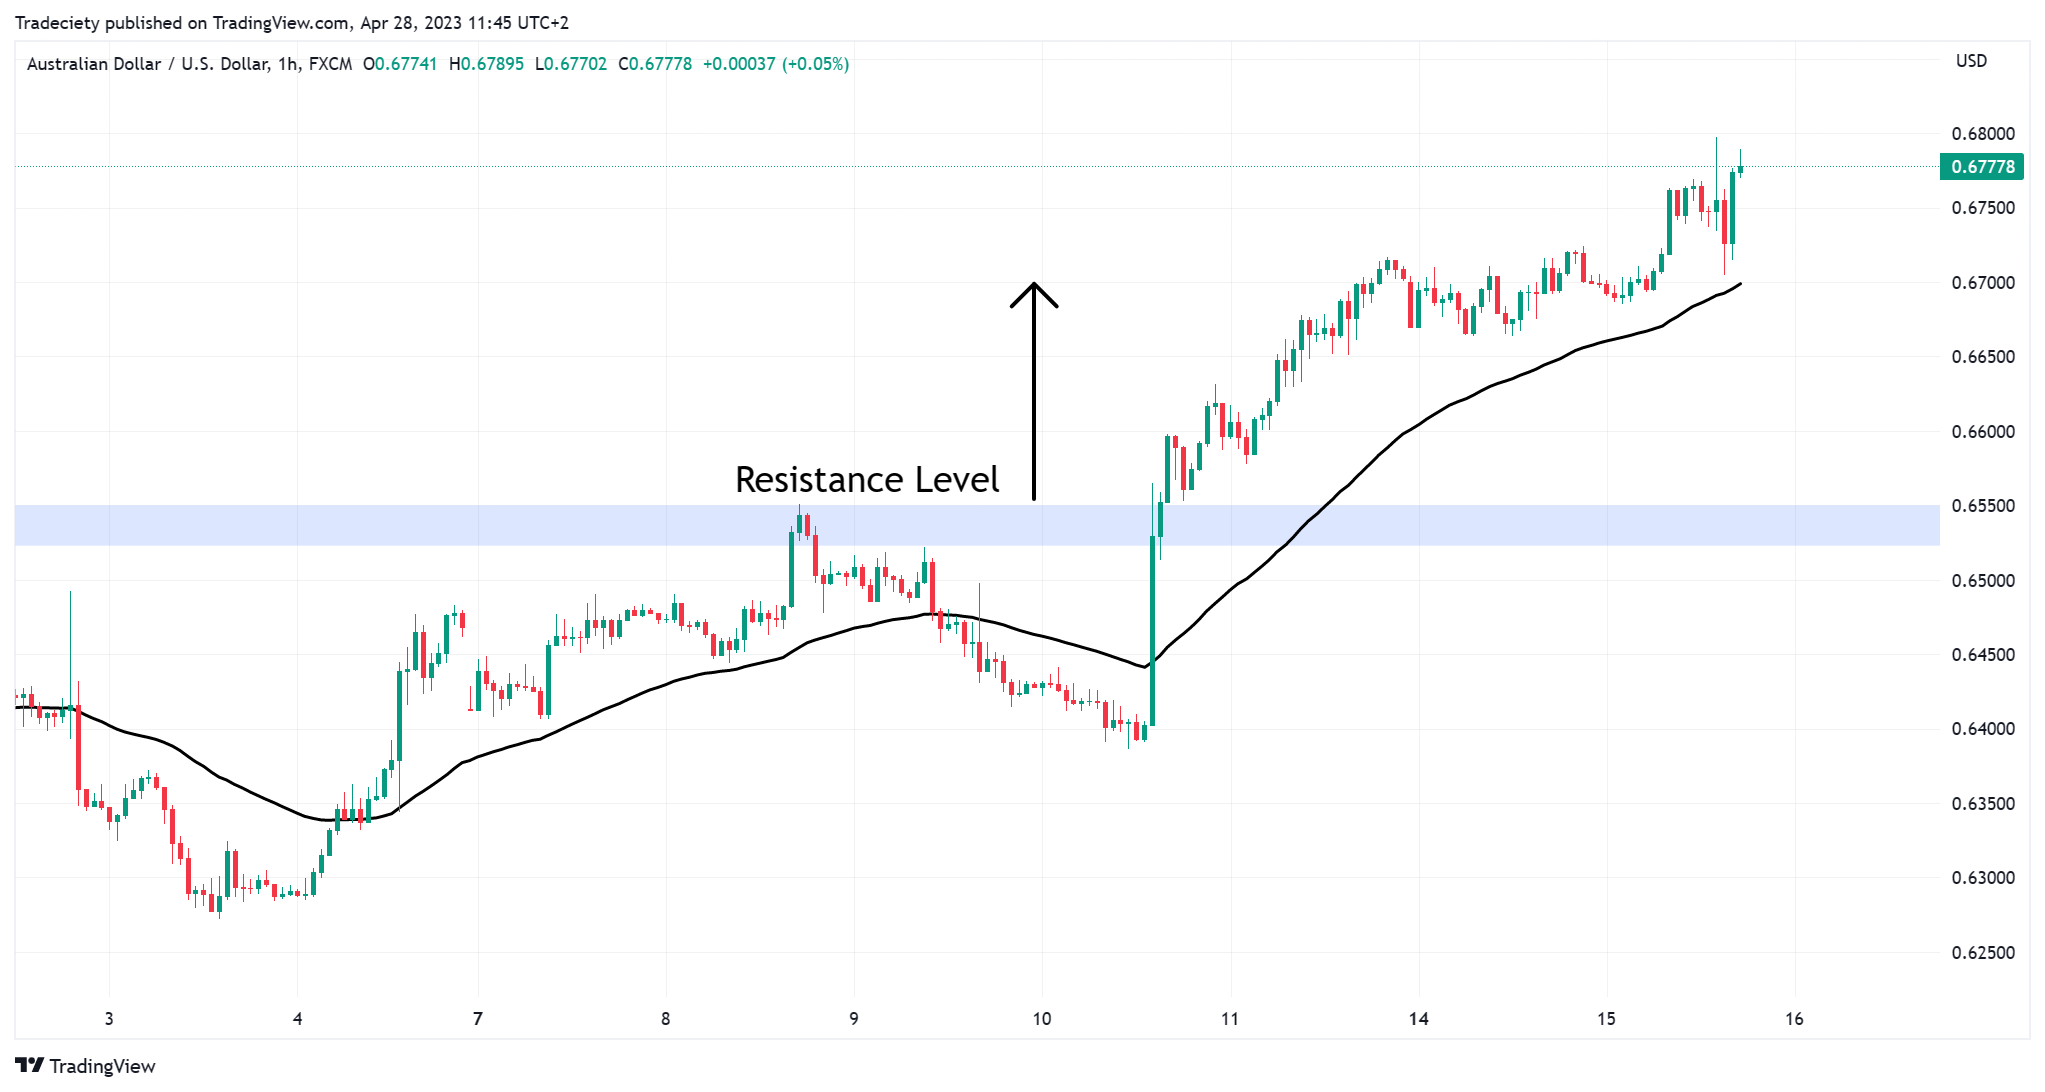
The image below shows the 1H timeframe after the break of the resistance level. The price trended higher after the breakout and the trader would have done well to adopt a bullish sentiment and look for bullish trend-continuations.
Instead of looking for a higher timeframe breakout, traders can also choose to look for a bounce off a support or resistance level when the level holds.
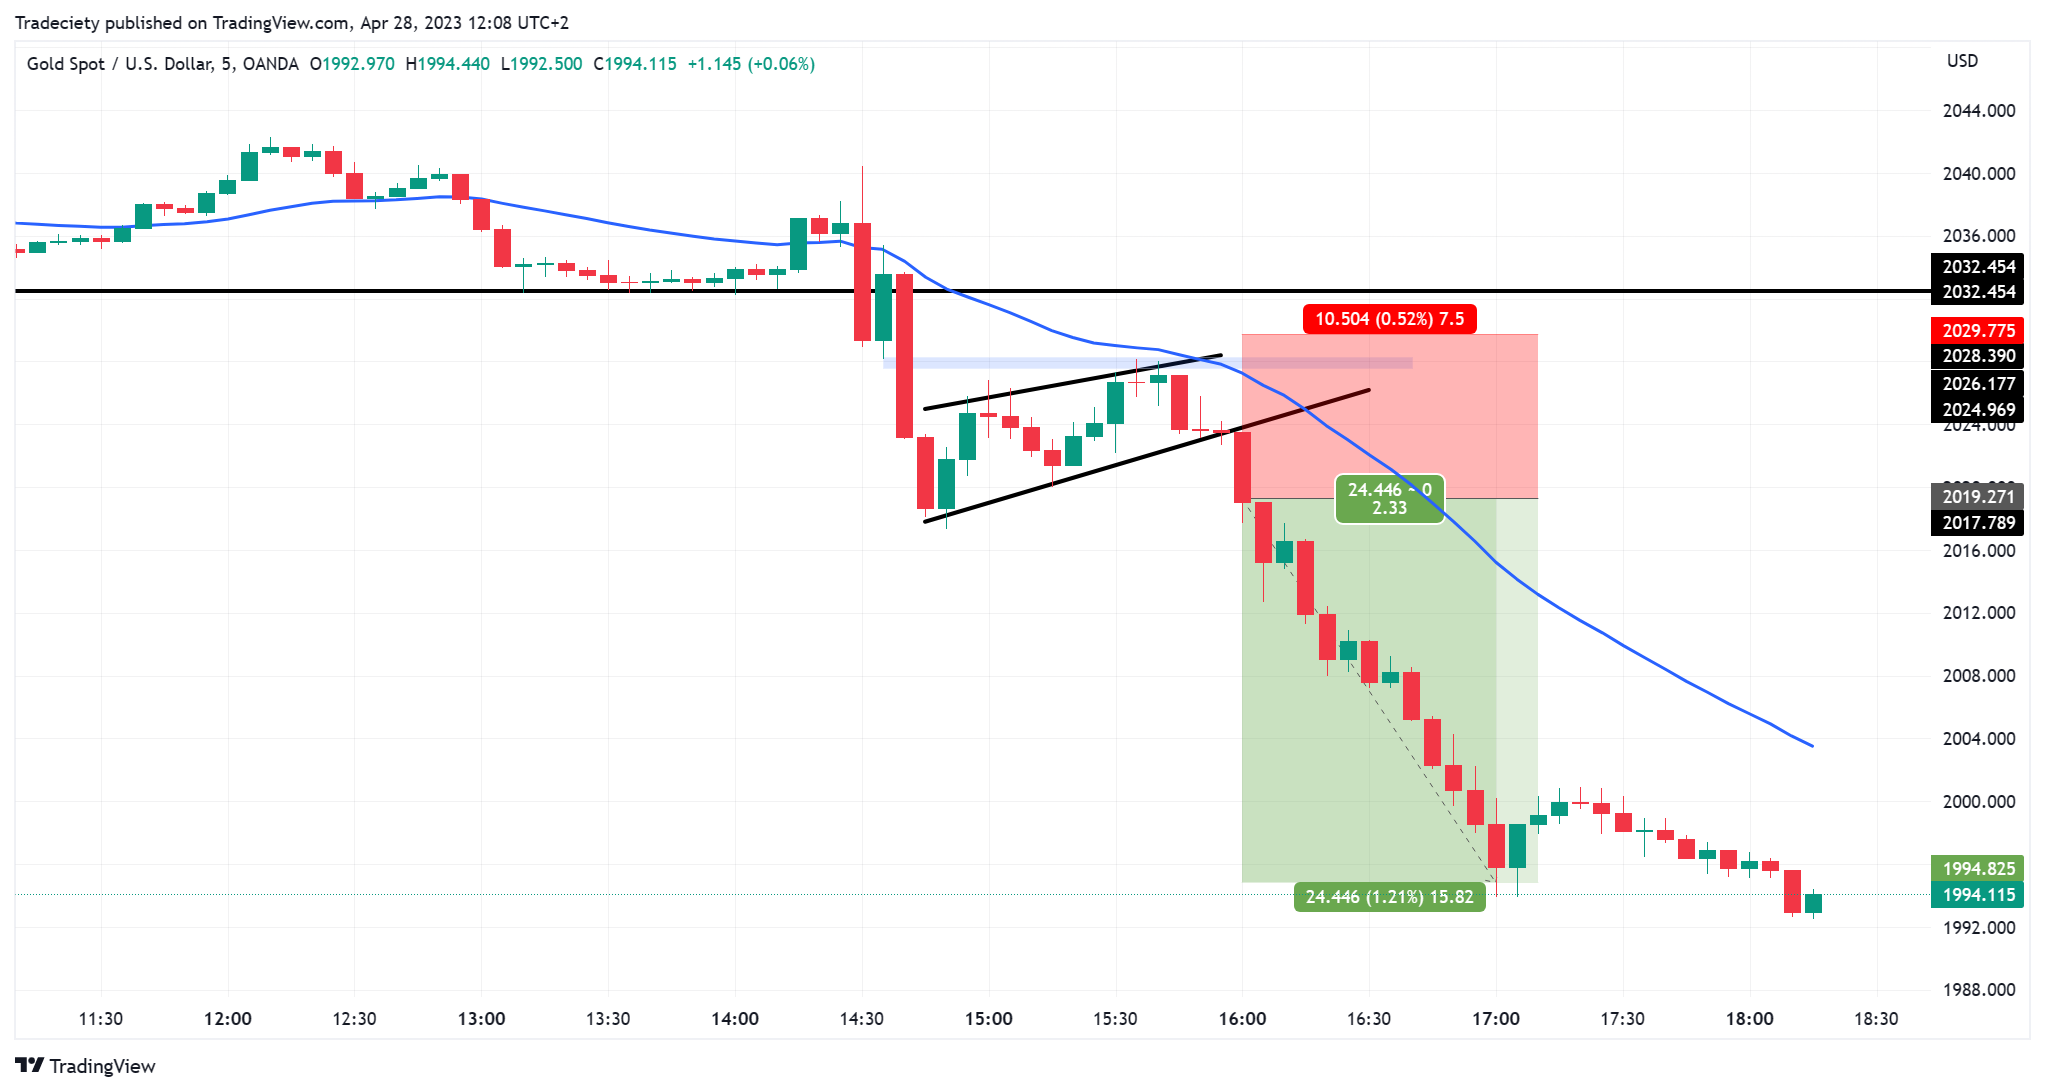
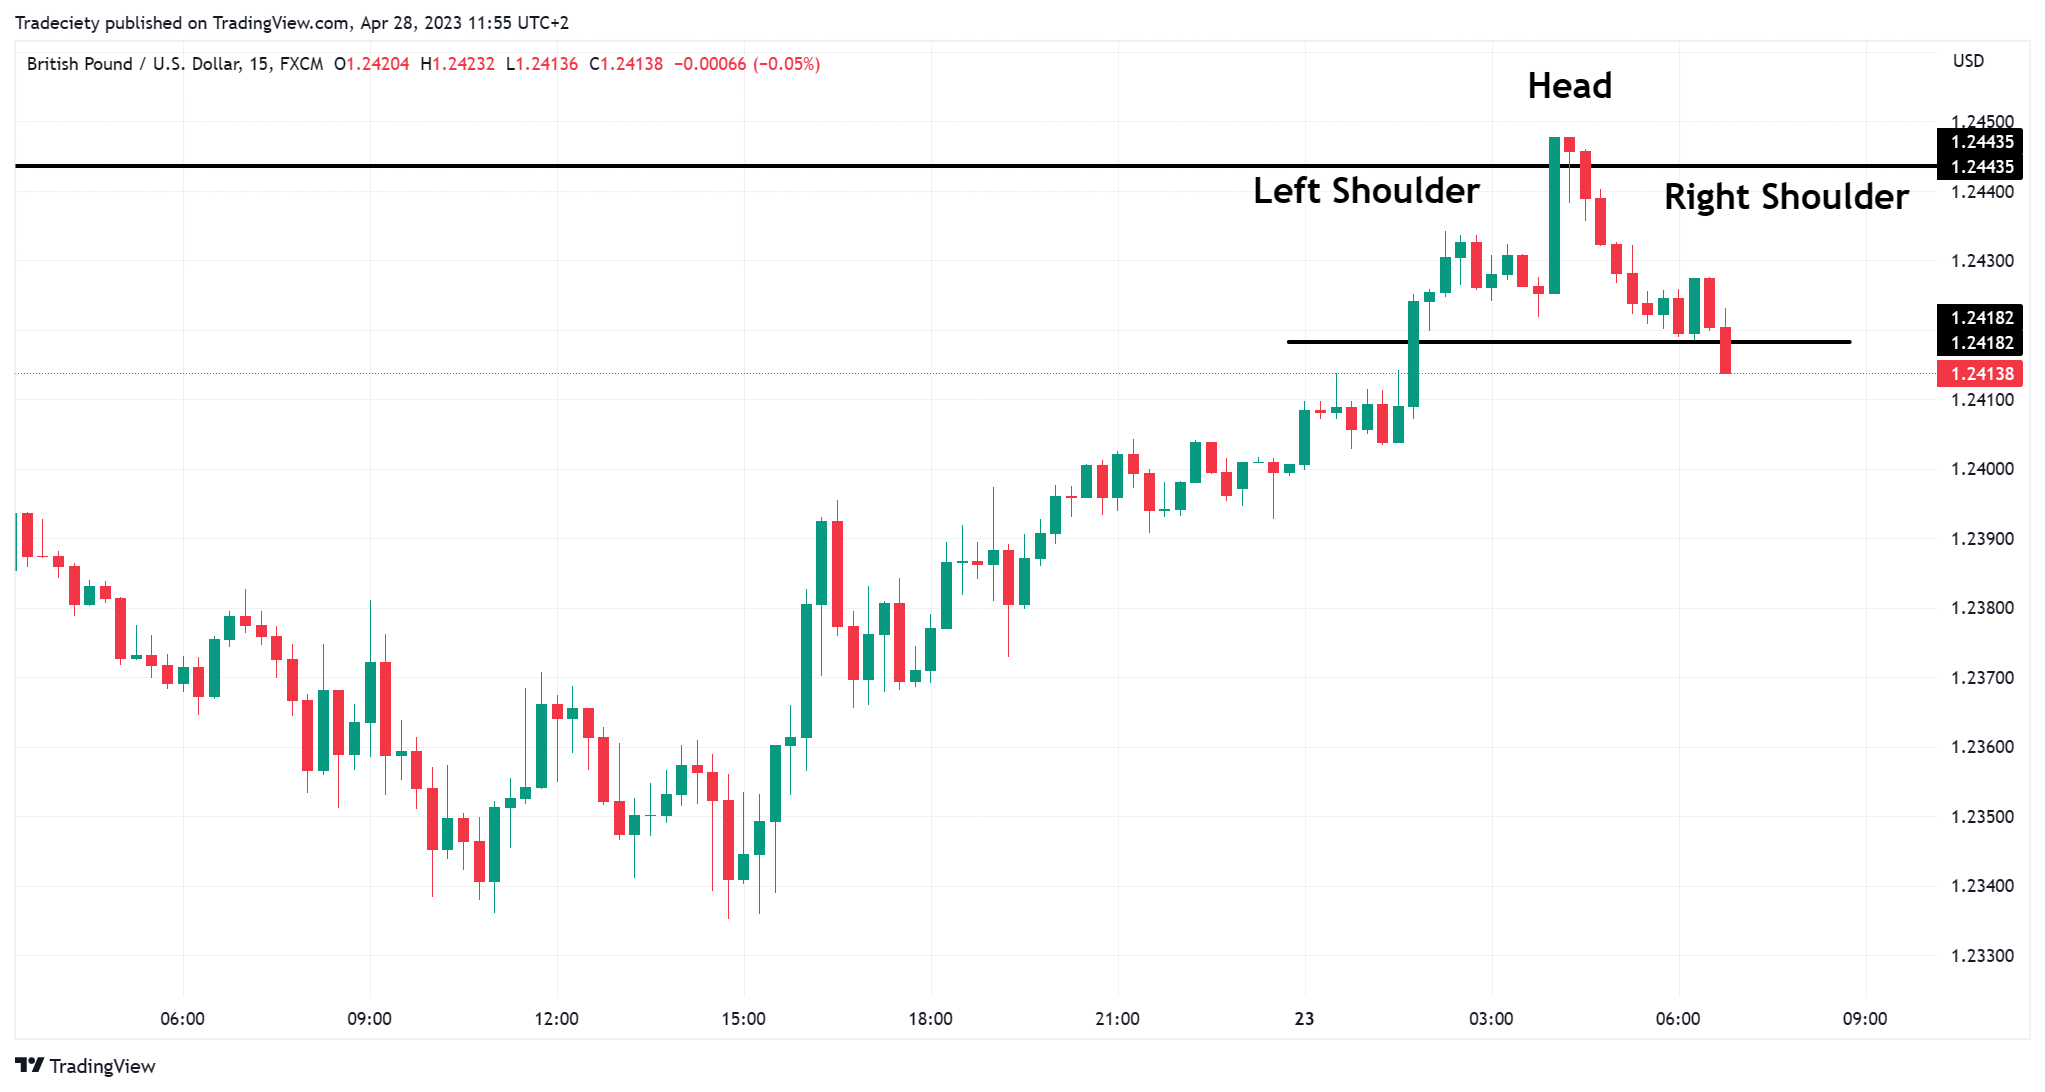
In the image below, the strong resistance level has been holding multiple times on the higher 4H timeframe. As long as the price is not able to close above the level, a trader might adopt a bearish trade sentiment; especially after seeing the signal of deceleration (smaller candlesticks).
The higher timeframe bearish bias can be used to look for short trading opportunities on the lower timeframe.
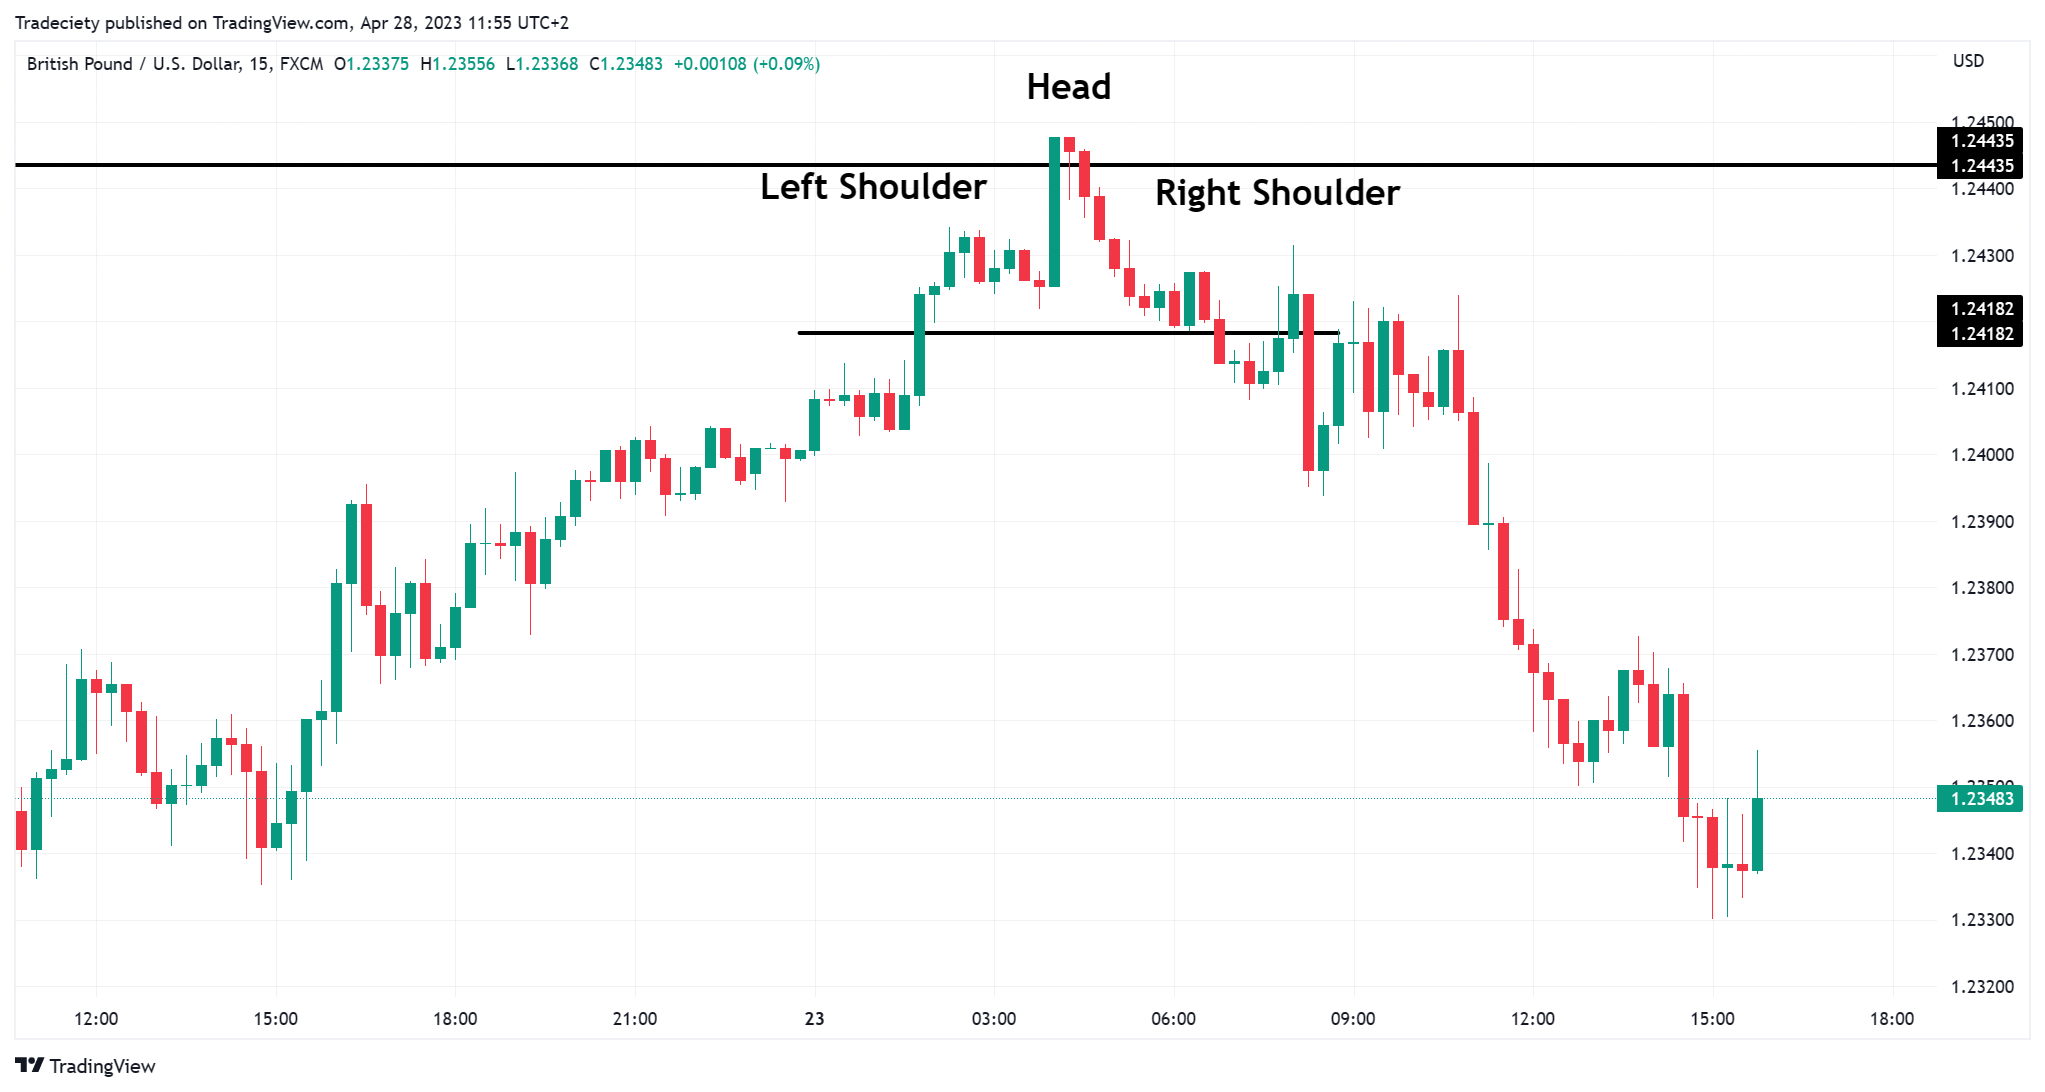
The lower 15-minute timeframe shows an interesting Head and Shoulders chart pattern right underneath the 4H resistance level. With the higher timeframe bearish bias in mind, a trader might have a trading plan to short the market after the successful breakout (or retest) of the neckline.
The price fell sharply after the breakout and retest of the Head and Shoulders pattern. The strong higher timeframe resistance level and the deceleration candle allowed the trader to adopt a bearish bias early on, while the lower timeframe helped the trader to time the short trade effectively.
Trading signals on a lower timeframe allow the trader to optimize the holding time and also the reward:risk ratio because the trade usually has a closer stop, and a more aggressive entry while utilizing a wider target based on the higher timeframe context.
Instead of using long-term support and resistance levels, some traders use local highs and lows for their multi-timeframe trading strategy.
The overall approach is hereby similar to the previously discussed support-and-resistance level strategy.
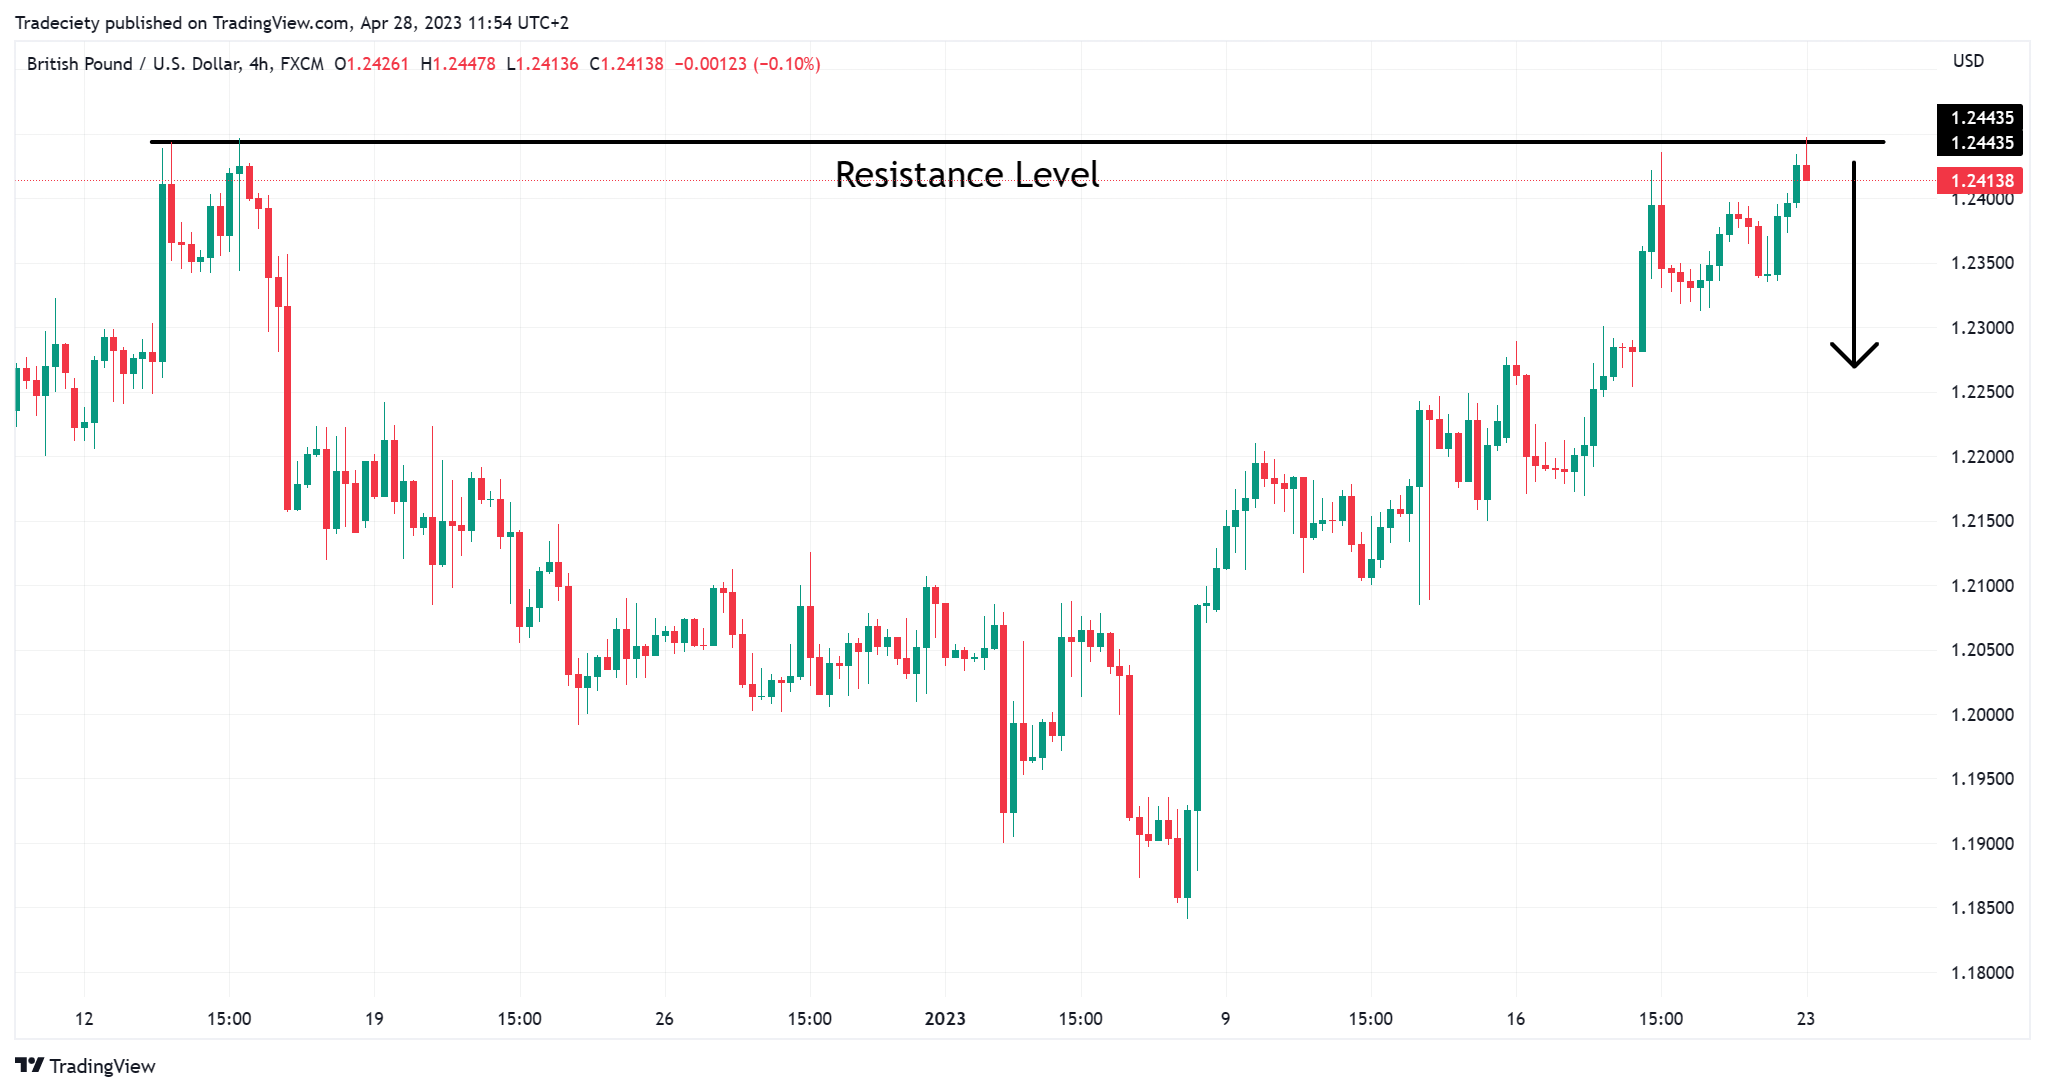
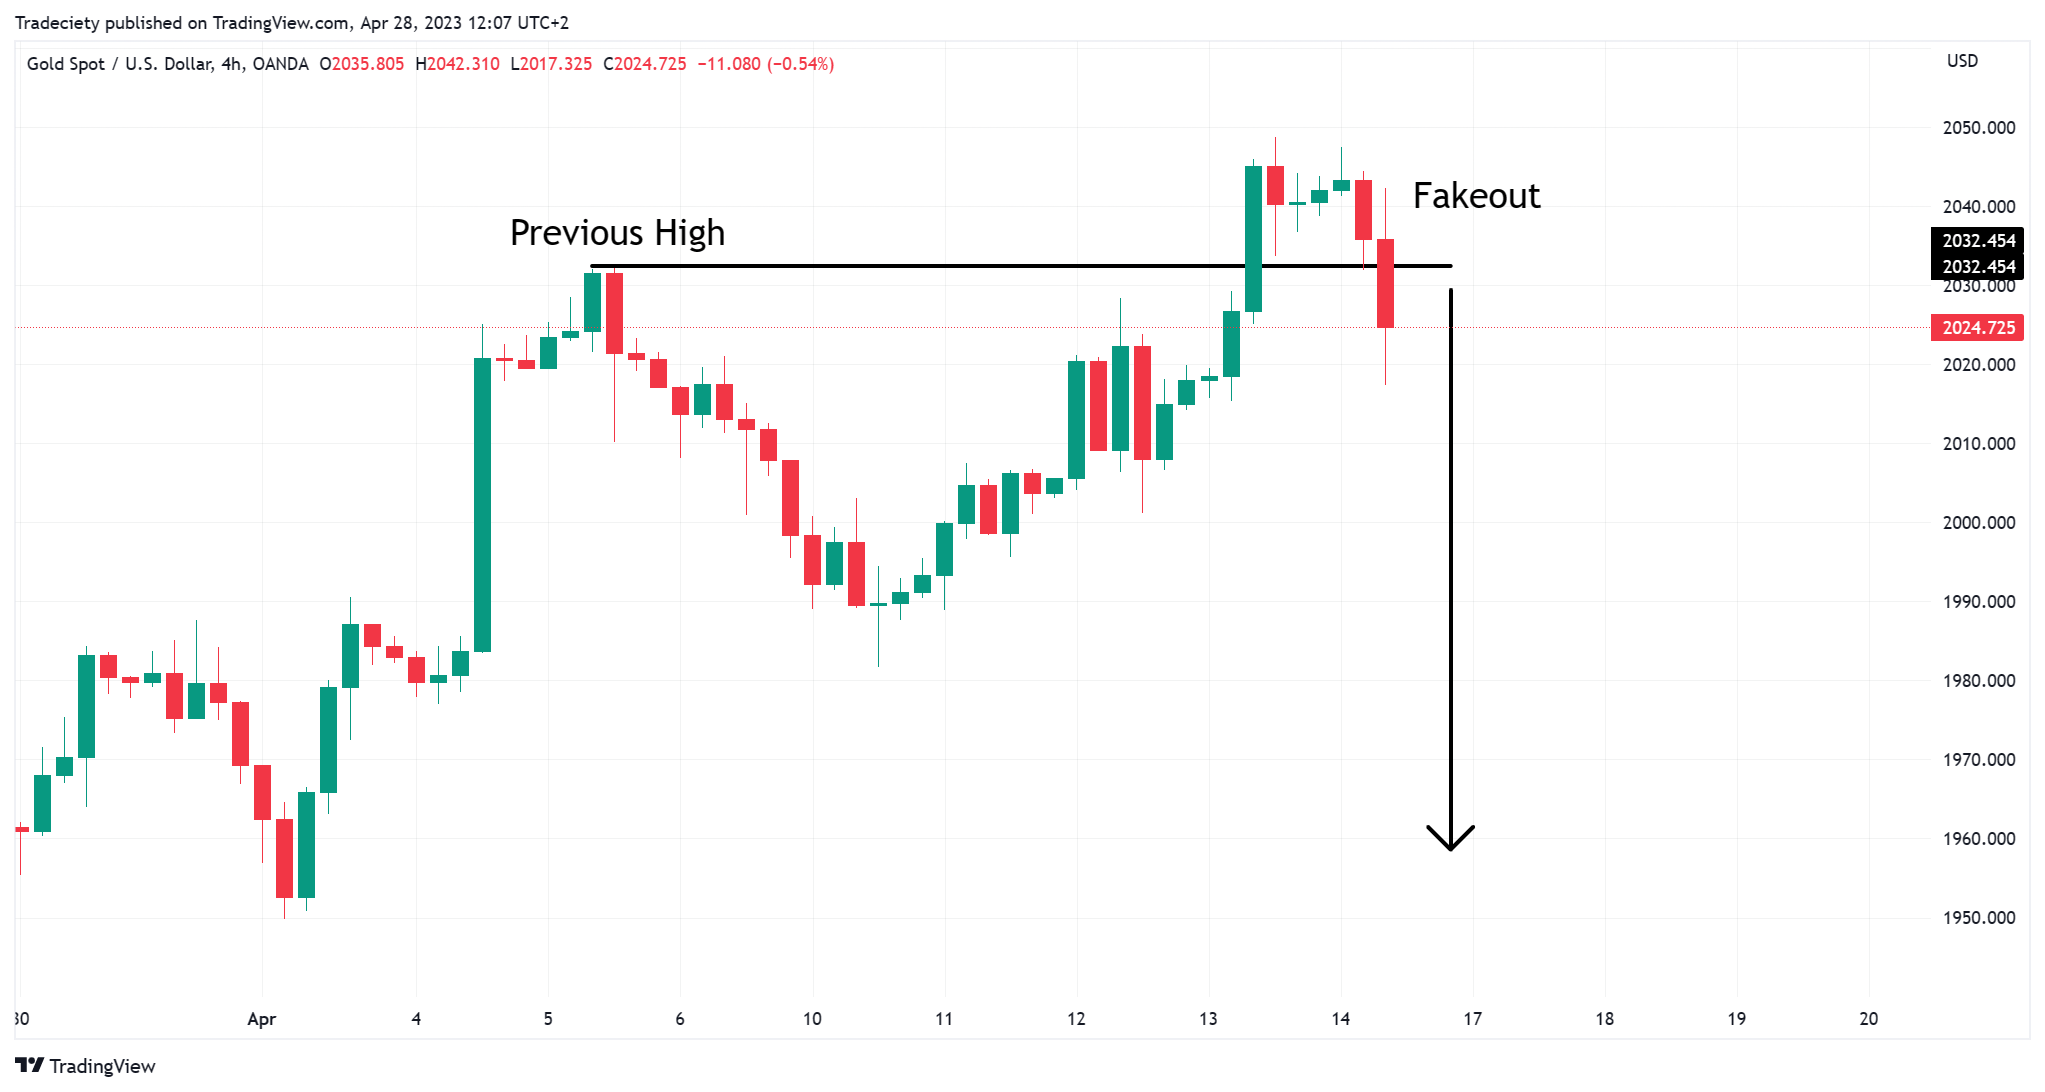
First, the trader is looking for a strong previous high (or low). In the image below, the price first overshot the previous high before strong bearish momentum entered the market and the price fell back below the high. In technical analysis, we refer to such a pattern as a fakeout (or trap) because the initial breakout is failing and trapping long-positioned breakout traders.
This higher timeframe signal is providing us with a bearish bias that we will carry over to our lower timeframe.
On the lower timeframe, the price is building a flag breakout pattern shortly after the fakeout signal (black horizontal line). Flags are among the most popular trend-continuation patterns. The break of the flag trendline typically signals the entry for a trend continuation.
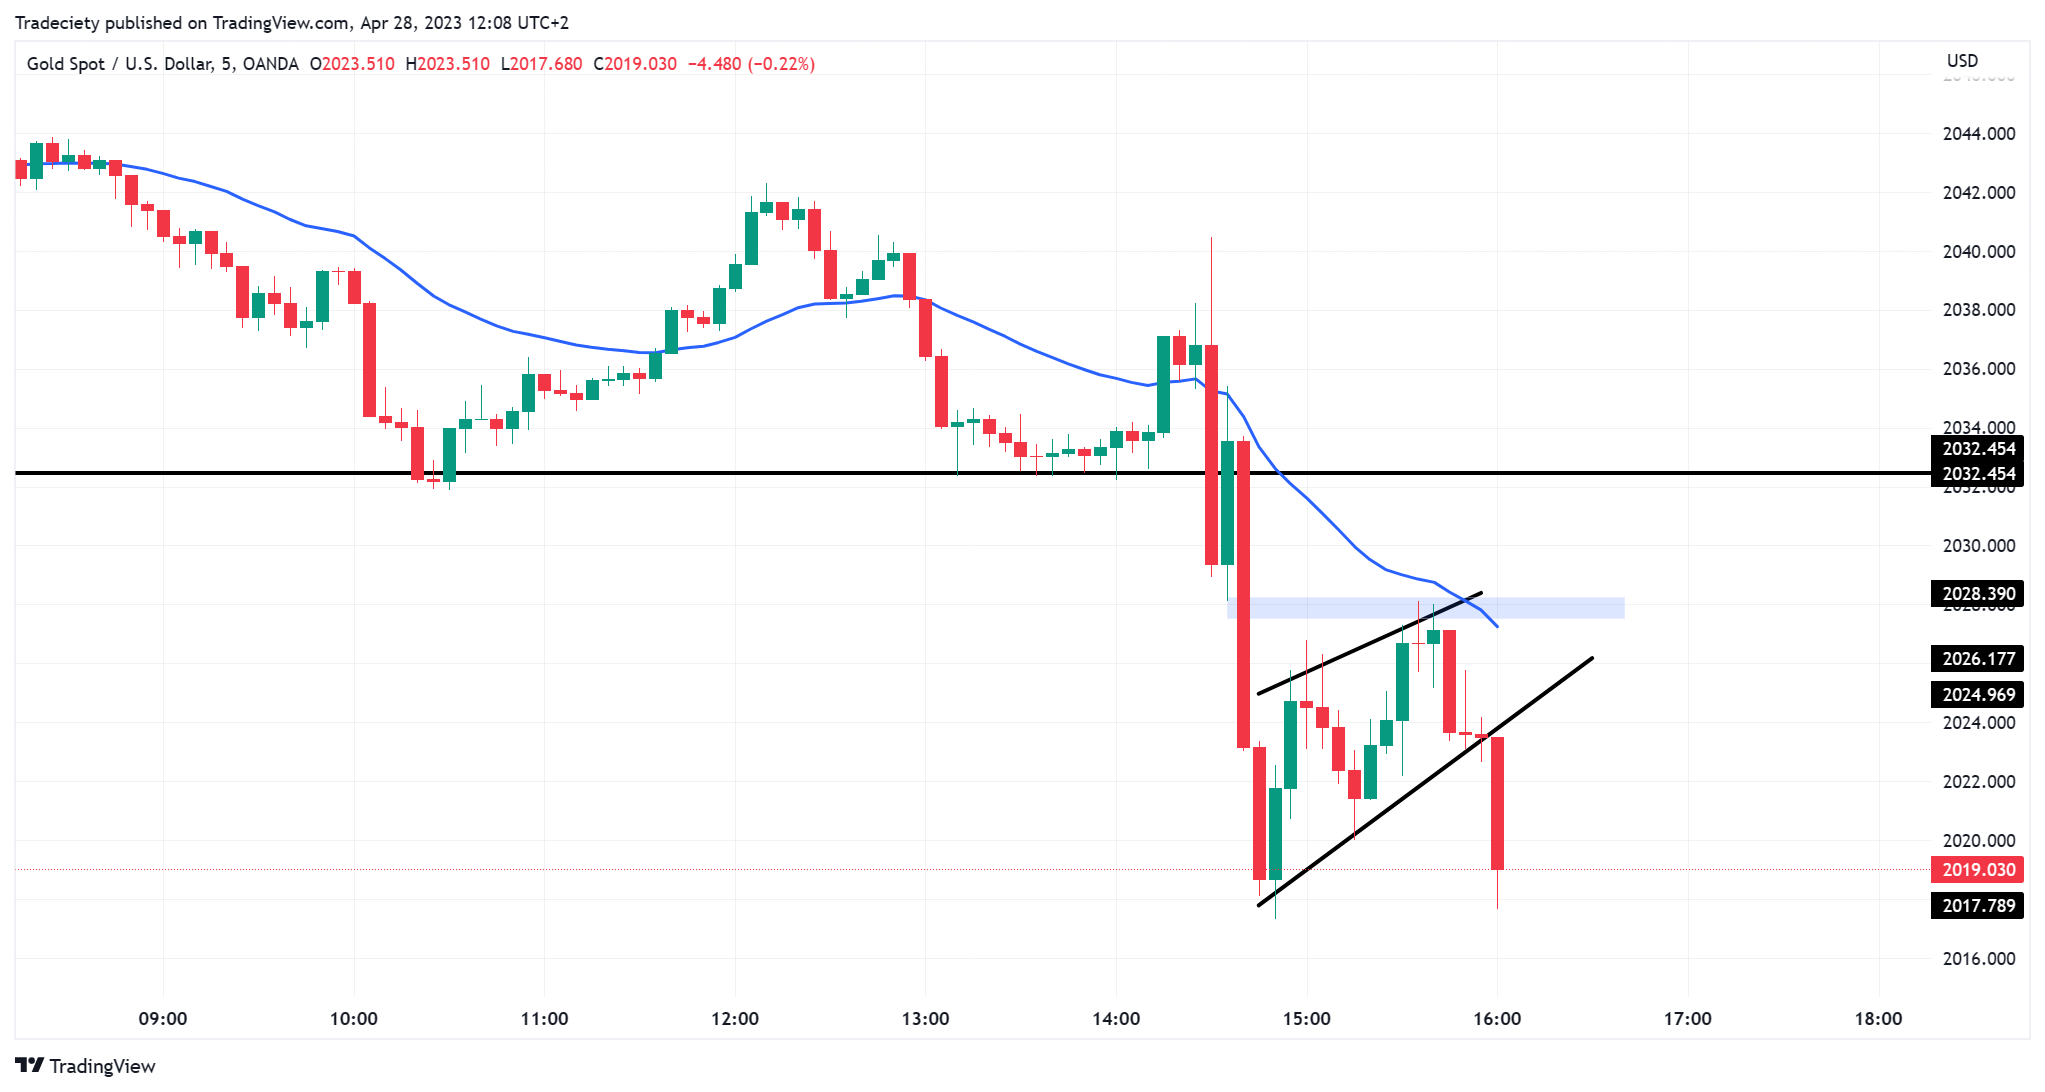
The downtrend unfolded after the flag breakout.
By using a top-down multi timeframe approach, traders can improve their strategy parameters such as reward:risk ratio, and the holding time of their trades.
Trading the fakeout directly on the higher timeframe usually results in significantly longer holding periods. By using the lower timeframe to time the entry and the exit, the holding time can often be reduced to an absolute minimum. The shorter the holding time, the fewer additional risk factors - such as news events or overnight exposure - the trader has.
Candlestick trading is a very popular trading approach, but it often lacks robustness when traders solely rely on a single candlestick. To improve the signal quality, traders can apply a multi-timeframe approach to candlestick signals.
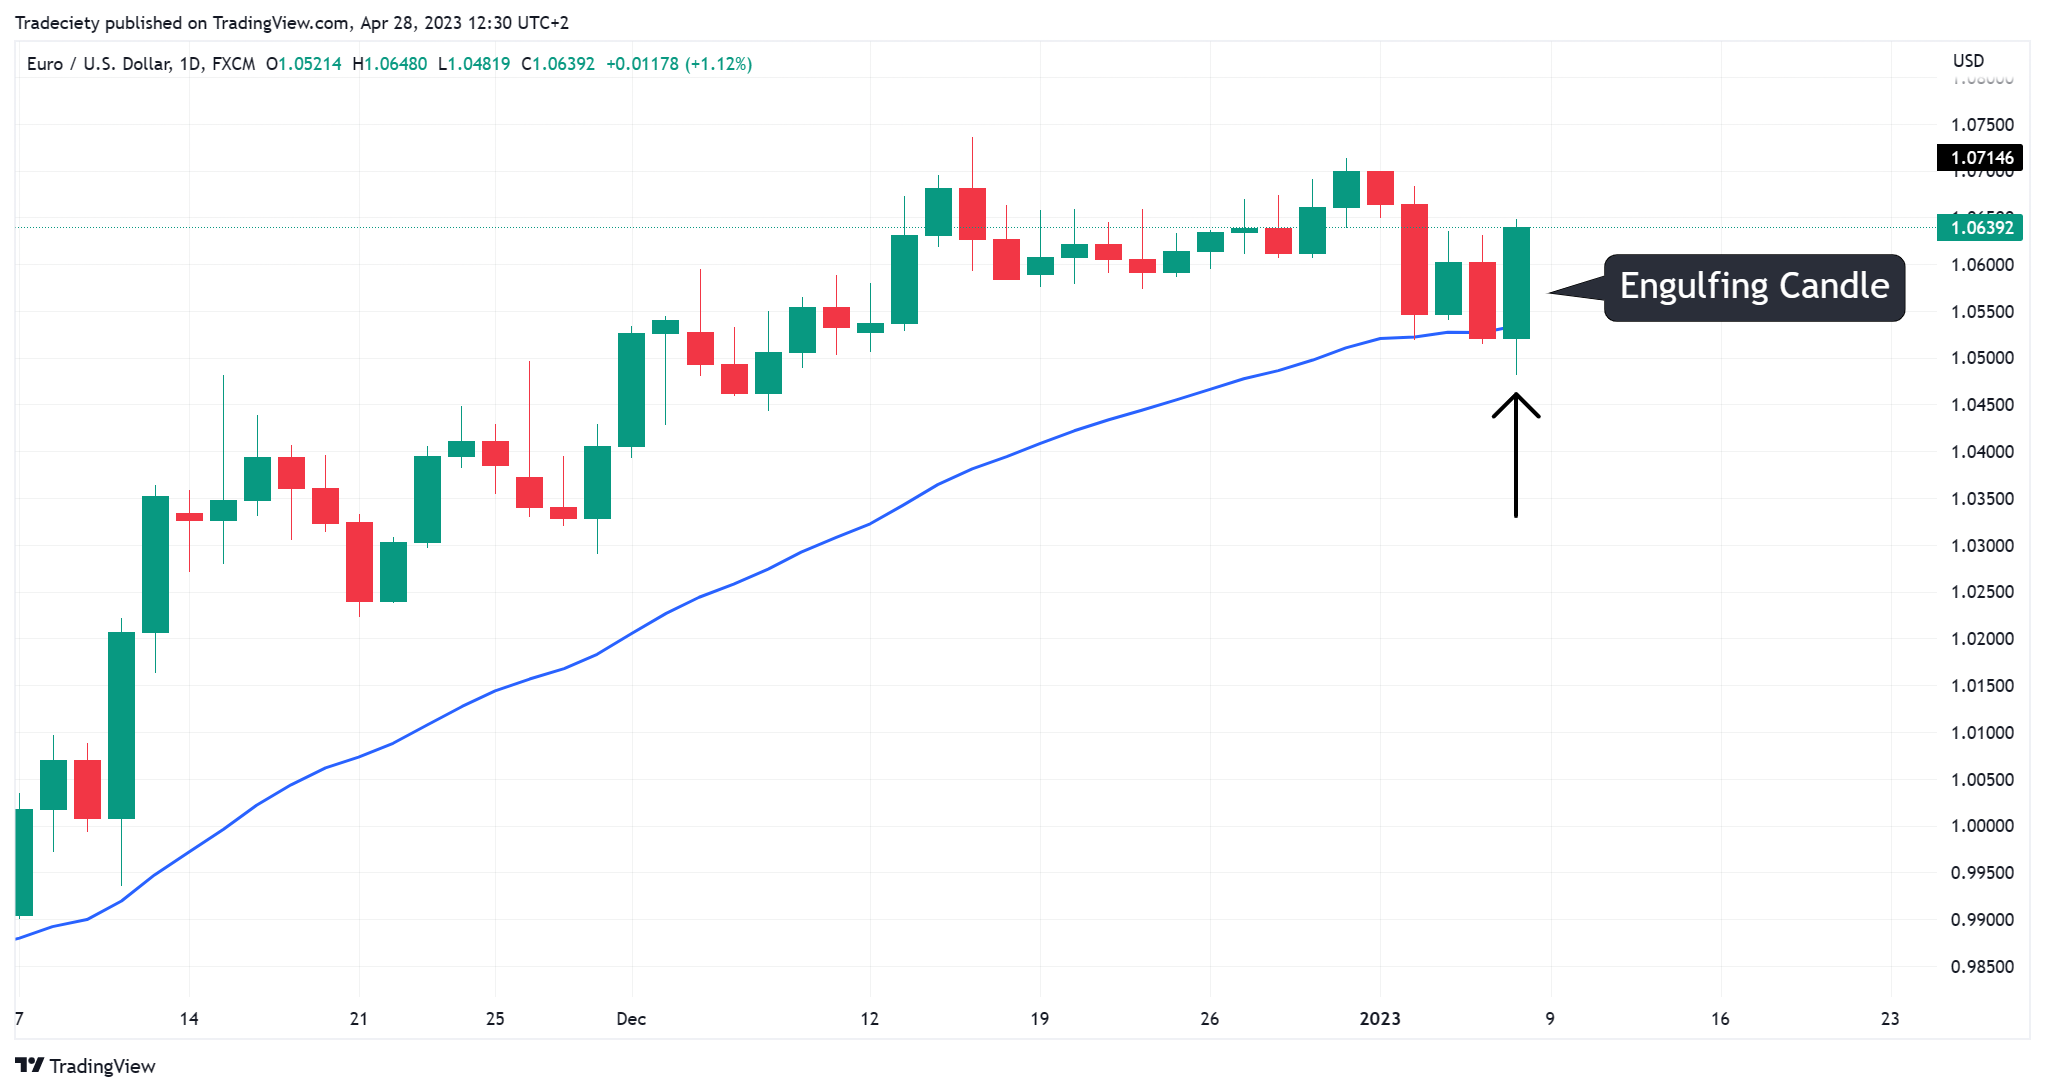
The image below shows a bullish engulfing candlestick on the higher Daily timeframe. At the same time, the price is in an overall bullish uptrend. Furthermore, the bullish candlestick also occurs right at the 30 EMA (moving average). Many traders use moving averages for their trend-following pullback trading.
The candlestick signal fits well into the trend narrative. After identifying the engulfing candlestick, a trader can now move to a lower timeframe to look for bullish trading signals into the higher timeframe bias.
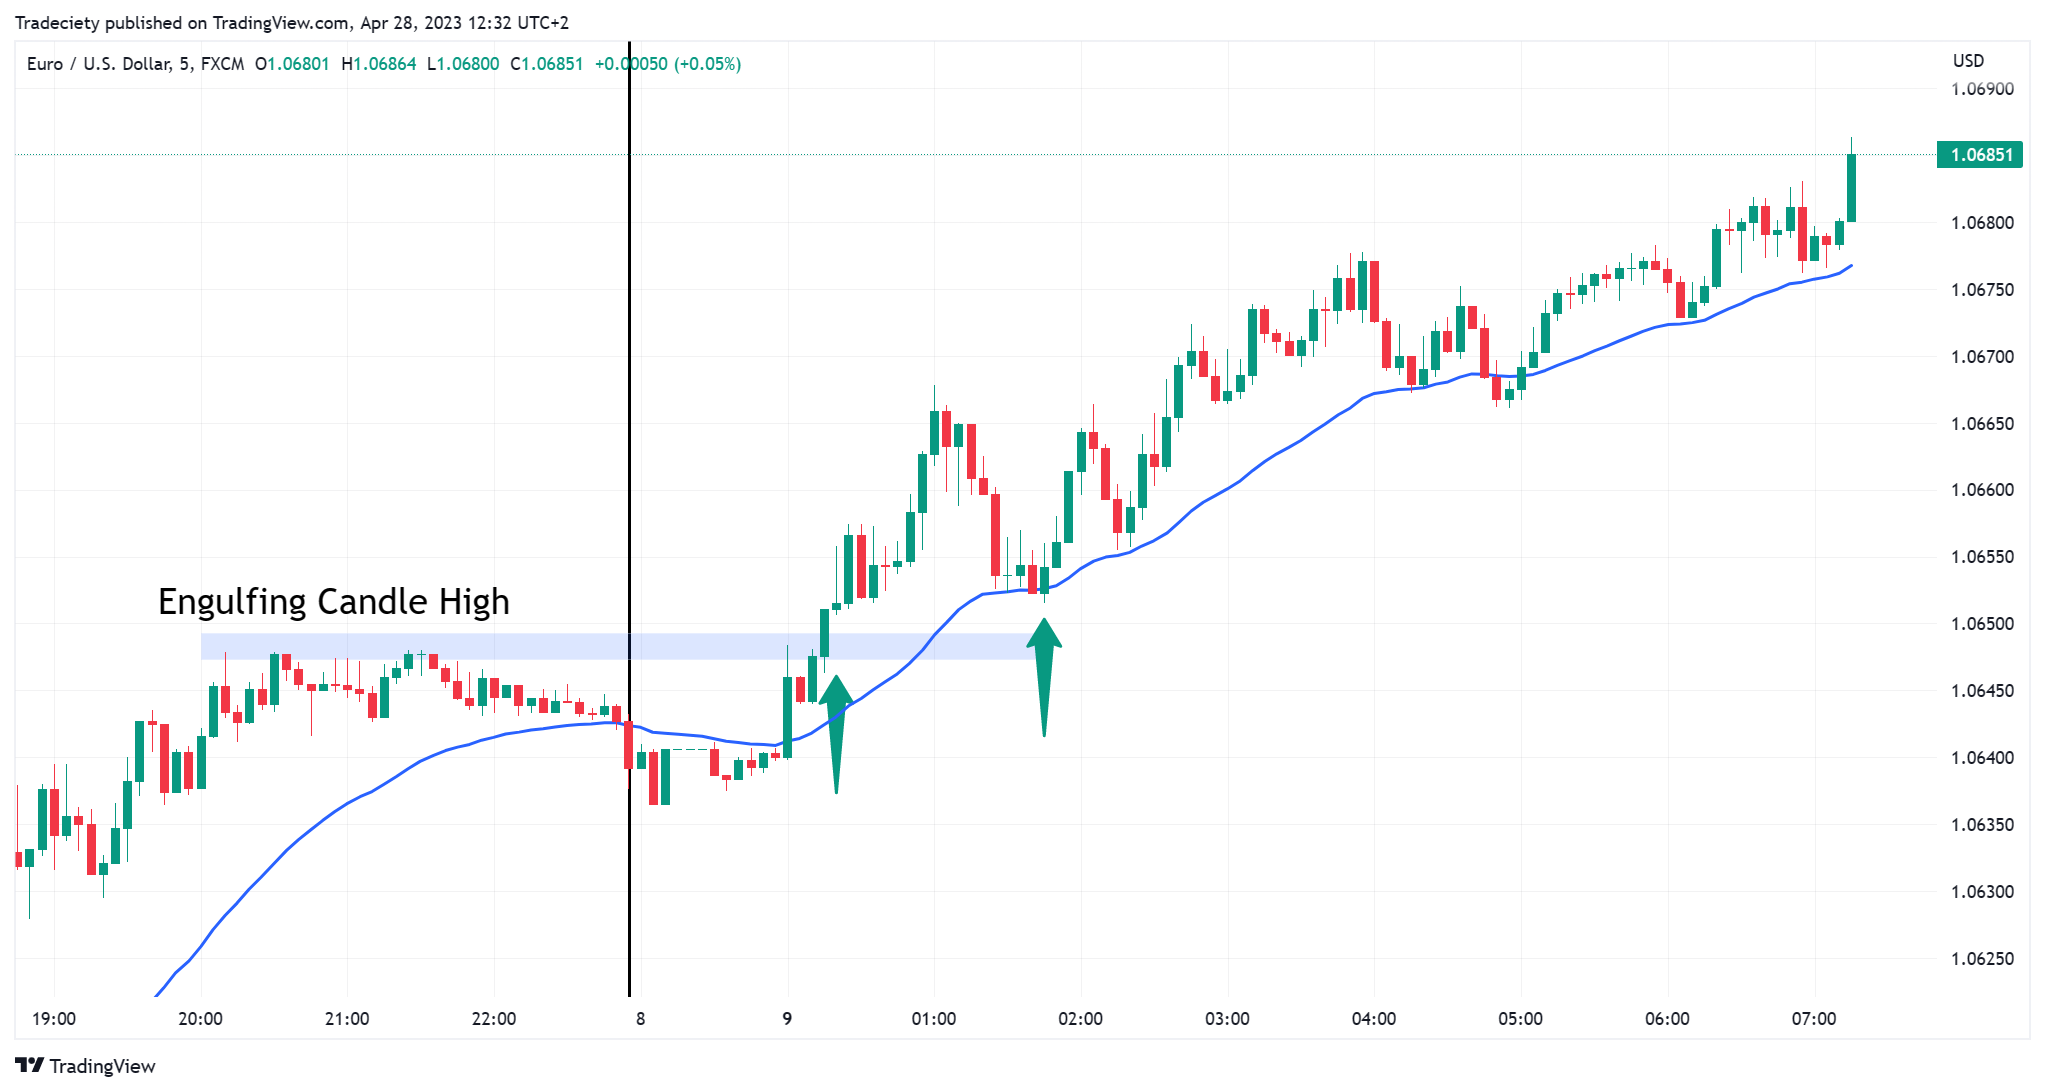
The image below shows the lower 5-minute timeframe. The blue zone on the left marks the high of the Daily engulfing candlestick. After the breakout, the price trended higher. A trend-following trader might have been able to execute a successful breakout long trade to capture the bullish momentum.
Whereas some traders might just trade the Daily signal blindly, a multi-timeframe approach allows the trader to find the perfect entry price and benefit from the short-term momentum that the engulfing candlestick signals.
Instead of looking for single candlesticks on the higher timeframe, traders can also use complex chart patterns as their signal for a higher timeframe bias.
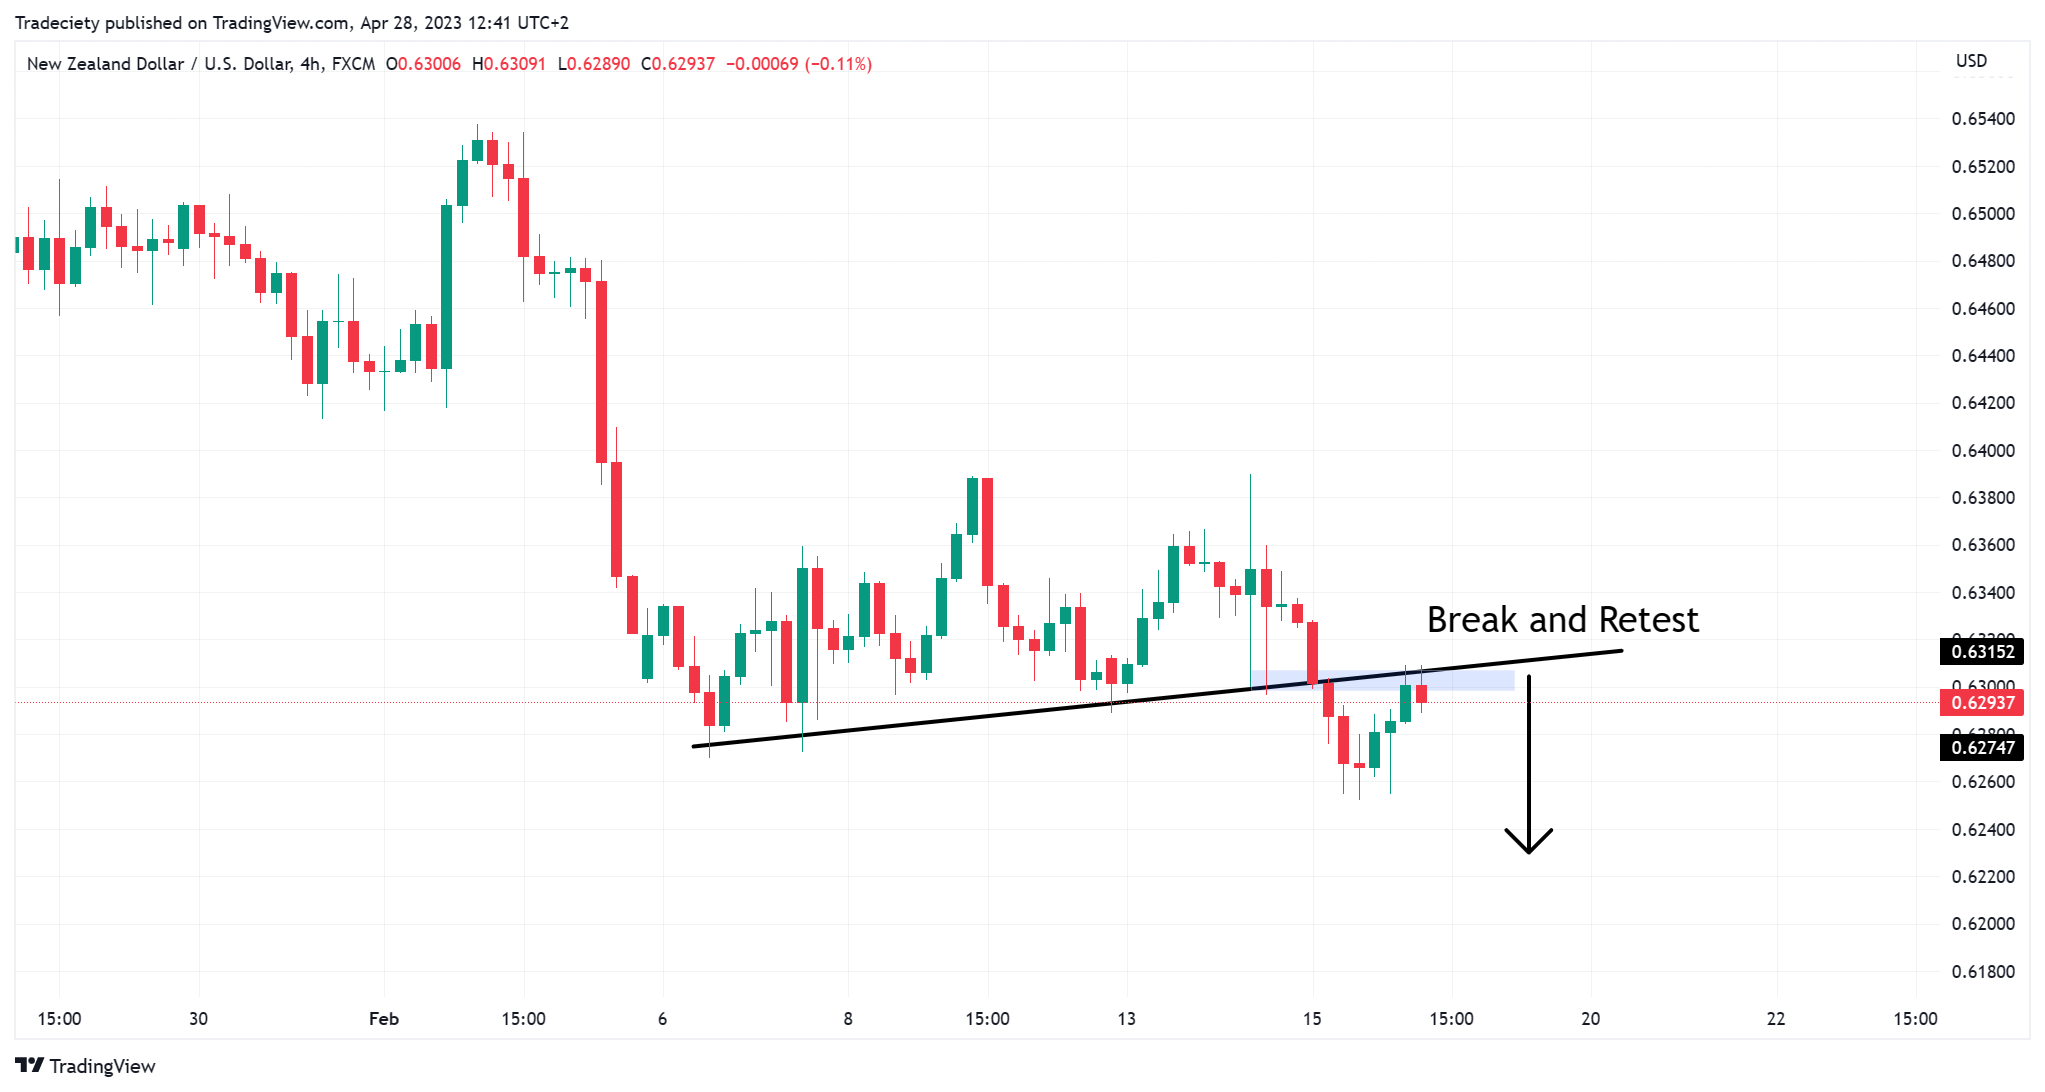
In the image below, the higher 4H timeframe shows an overall bearish trend with a sideways flag pattern. The trendline describes the lower boundaries of the flag pattern.
After the breakout, the price is returned to the trendline to perform a retest. When the price reaches the trendline, the candlestick signals deceleration - the candlestick turns and shows bearish momentum. This signal could be used to move to a lower timeframe with a bearish bias in mind.
At the time of the higher timeframe retest signal, the lower 5-minute timeframe forms a triple top range pattern. Lower timeframe patterns are ideal when it comes to trading plan creation because they offer a clear and objective entry point. For a short trading plan, the trader waits for a bearish breakout below the low of the pattern.
A breakout then signals a trade entry. In this case, the trader is going with the higher timeframe trend and also with the lower timeframe breakout momentum. Both timeframes are perfectly aligned.
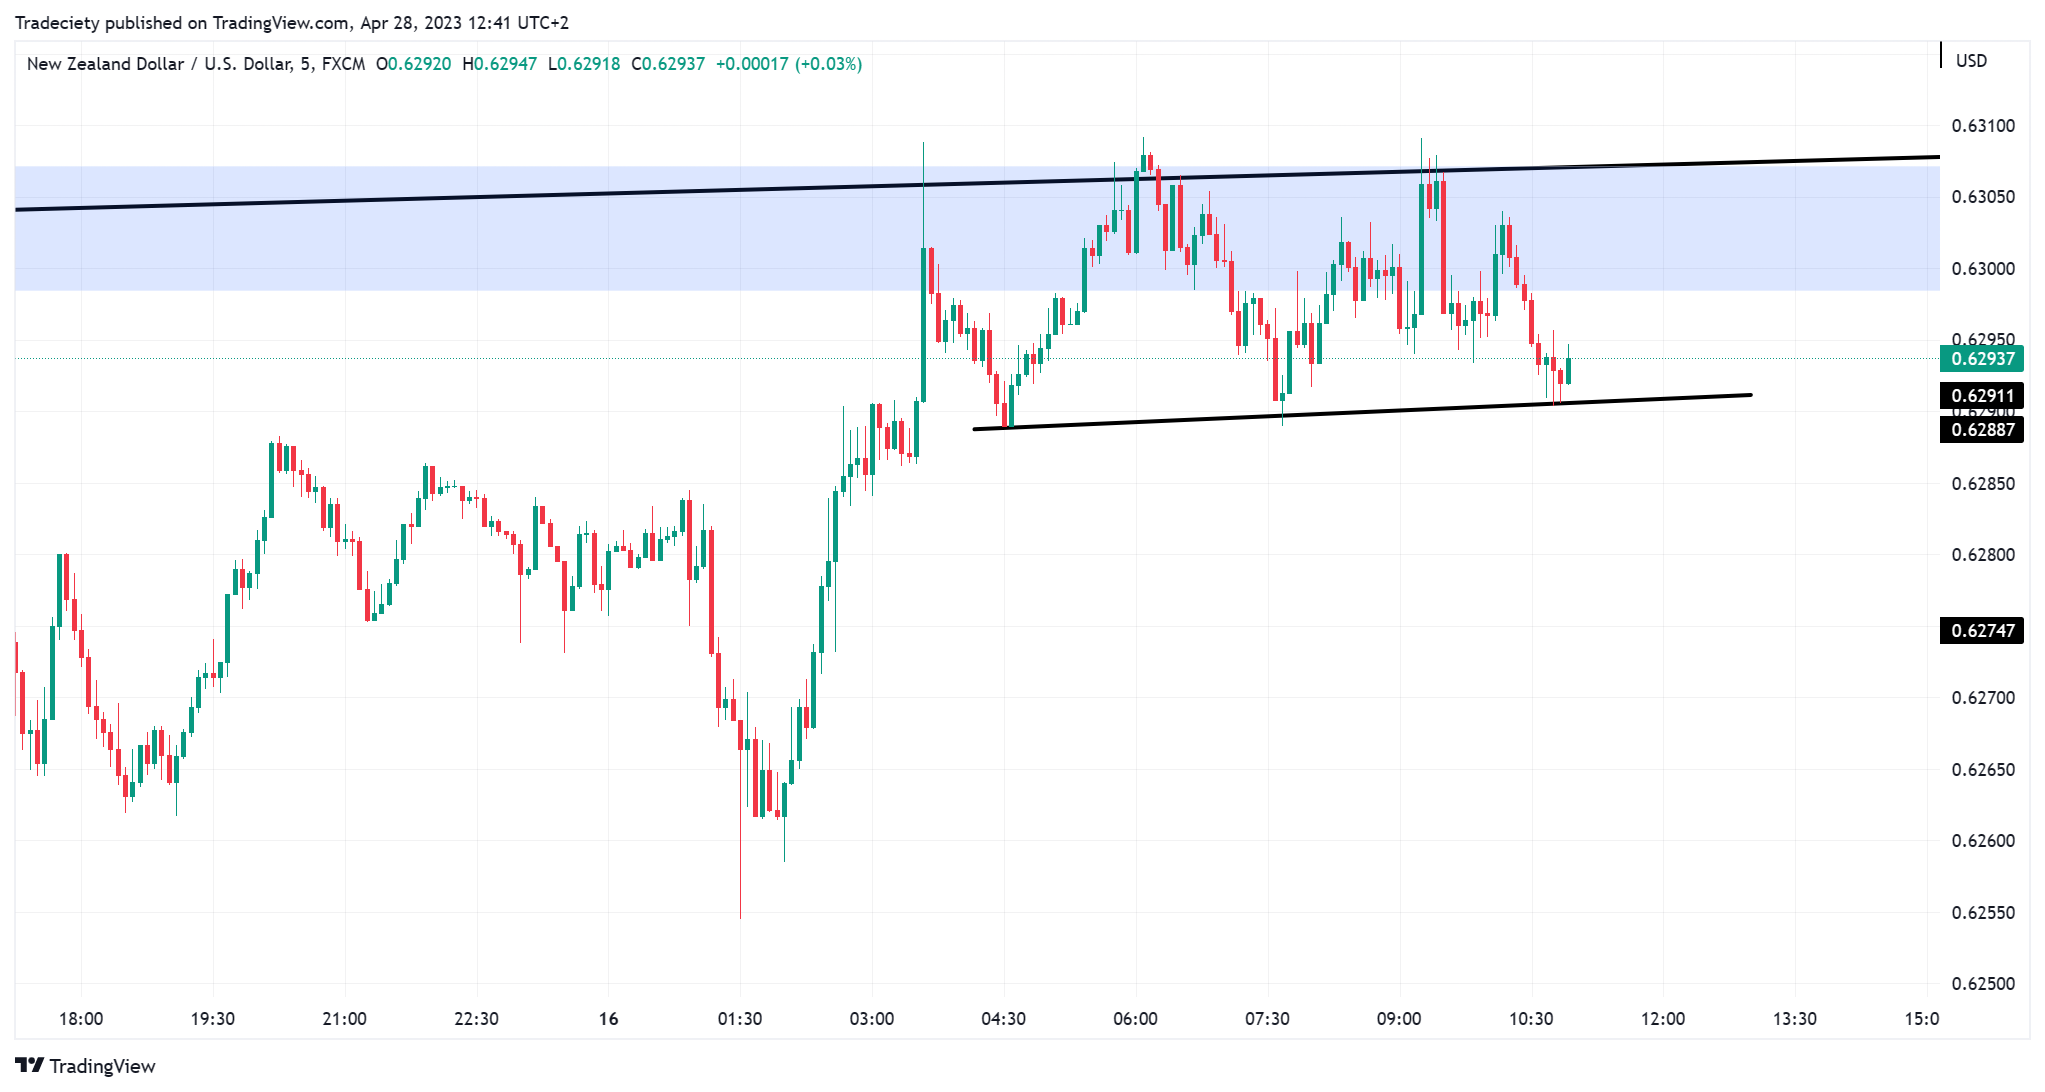
After the breakout, the price fell sharply. The long-term trend continued and with the lower timeframe signal, a trader might have been able to execute a high reward:risk ratio trade.
By no means are the introduced trading approaches the only ones for multi-timeframe trading; they just serve as a source of inspiration to create your own multi-timeframe trading strategy.
There are no limitations when it comes to building a multi-timeframe strategy and traders can make use of all types of trading tools and concepts. Be it price action, classic chart patterns, or indicator signals, all combinations are possible.
The most important aspect of a multi-timeframe trading strategy (and of all other trading approaches for that matter) is consistency. Resist the urge to jump around timeframes and always want to combine new timeframes.
The more noise and inconsistencies you have in your trading, the worse the results typically are. Therefore, pick one timeframe combination and stick with it for at least 30 trades to get a rough idea of how well it fits into your overall trading philosophy. After 30 trades with the same approach, you will have a much better idea of how well it suits you and you can analyze its effectiveness in your trading journal ![]() .
.
Here are my final tips when it comes to multi-timeframe trading:
Have I missed something? Take a look at the video below and leave a comment on YouTube. I look forward to hearing from you.
external link:


We have been trading supply and demand strategies for over ten years, and they have stood the test of time remarkably well. Supply and demand is...

3 min read
Choosing the right trading journal is essential for traders wanting to analyze performance, refine strategies, and improve consistency. In this...

3 min read
“95% of all traders fail” is the most commonly used trading related statistic around the internet. But no research paper exists that proves this...