Supply and Demand Trading in 2026
We have been trading supply and demand strategies for over ten years, and they have stood the test of time remarkably well. Supply and demand is...

Divergences are one of my favorite trading concepts because they offer very reliable high-quality trading signals when combined with other trading tools and concepts.
Although indicators are somewhat lagging – just like price action is lagging too – when it comes to divergences, this lagging feature is actually going to help us find better and more reliable trade entries as we will see below. Divergences can not only be used by reversal traders but also trend-following traders can use divergences to time their exits.
In my own trading strategy, divergences are a big part for one of my setups and in combination with other signals. I do not recommend trading divergences by themselves but they are a good starting point.
Let’s start with the most obvious question and explore what a divergence really is and what it tells you about price. You’d be surprised how many people get this wrong already.
A divergence forms on your chart when price makes a higher high, but the indicator you are using makes a lower high. When your indicator and price action are out of sync it means that “something” is happening on your charts that require your attention and it’s not as obvious by just looking at your price charts.
Basically, a divergence exists when your indicator does not “agree” with price action. Granted, this is very basic and we will now explore more advanced divergence concepts and see how to trade them, but it’s important to build a solid foundation.
Bearish and bullish divergence. Price and indicator are out of sync. Divergence foreshadows reversal.
#1 Revisiting the RSI
Divergences work on all indicators, but my favorite by far is the RSI (Relative Strength Index). The RSI compares the average gain and the average loss over a certain period. So for example, if your RSI is set to 14, it compares the bullish candles and the bearish candles over the past 14 candles. When the RSI value is low, it means that there were more and stronger bearish candles than bullish candles over the past 14 candles; and when the RSI is high it means that there were more and larger bullish candles over the past 14 candles.
#2 When does an RSI divergence form?
Understanding when your indicator is high or low is important when it comes to interpreting divergences and I generally encourage traders to look beyond the squiggly lines of their indicators to explore what it really does.
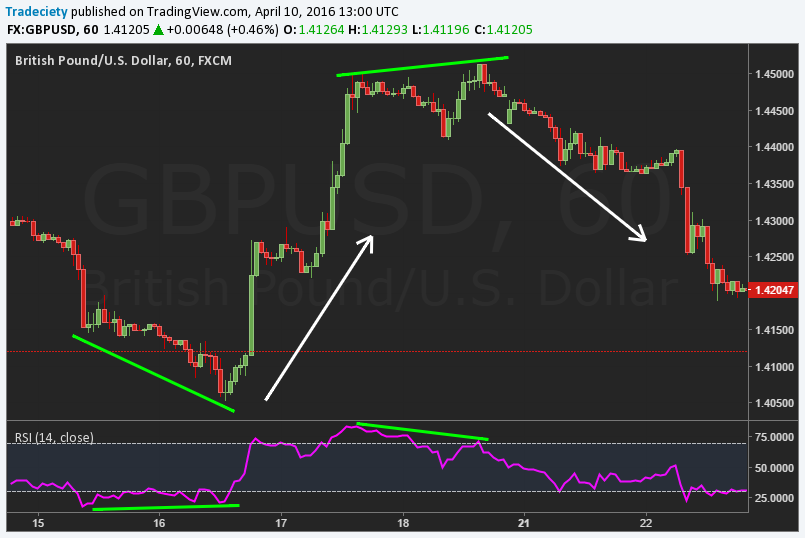
During trends, you can use the RSI the compare the individual trend waves and so get a feeling for the strength of the trend. Here are the three scenarios and the screenshot below shows every single one:
(2) Typically, the RSI makes higher highs during healthy and strong bullish trends. This means that there were more and larger bullish candles in the most recent trend wave than there were compared to the previous wave.
(1) When the RSI makes similar highs during an uptrend it means that the momentum of the trend is unchanged. When the RSI makes an equal high, it does not qualify as a divergence because it just means that the strength of the uptrend is still up and stable. Higher highs on the RSI do not show a reversal or weakness. It just means that the trend is progressing unchanged.
(3) When you see that price is making a higher high during a bullish trend, but your RSI makes a lower high, it means that the most recent bullish candles were not as strong as previous price action and that the trend is losing momentum. This is what we call a divergence and in the screenshot below, the divergence signaled the end of the uptrend and it makes a downtrend possible.
#3 Conventional technical analysis is flawed
Classic technical analysis tells us that a trend exists when price makes a higher high – but like too often, conventional wisdom is seldom right and usually simplifies things too much. A trader who only relies on highs and lows for his price analysis often misses important clues and does not fully understand market dynamics. Even though a trend could look “healthy” at first glance (higher highs and higher lows), it might be losing momentum at the same time when we look deeper at the candles and the momentum.
Spotting a divergence on your momentum indicator, thus, tells you that the dynamics in the trend are shifting and that, although it could still look like a real trend, a potential end of the trend could be near.
A divergence does not always lead to a strong reversal and often price just enters a sideways consolidation after a divergence. Keep in mind that a divergence just signals a loss of momentum, but does not necessarily signal a complete trend shift.
To avoid trade entries that don’t go anywhere, I highly suggest you add other criteria and confirmation tools to your arsenal. A divergence alone is not something that strong enough and many traders experience bad results when trading only with divergences. Just like any trading strategy, you need to add more confluence factors to make your strategy strong.
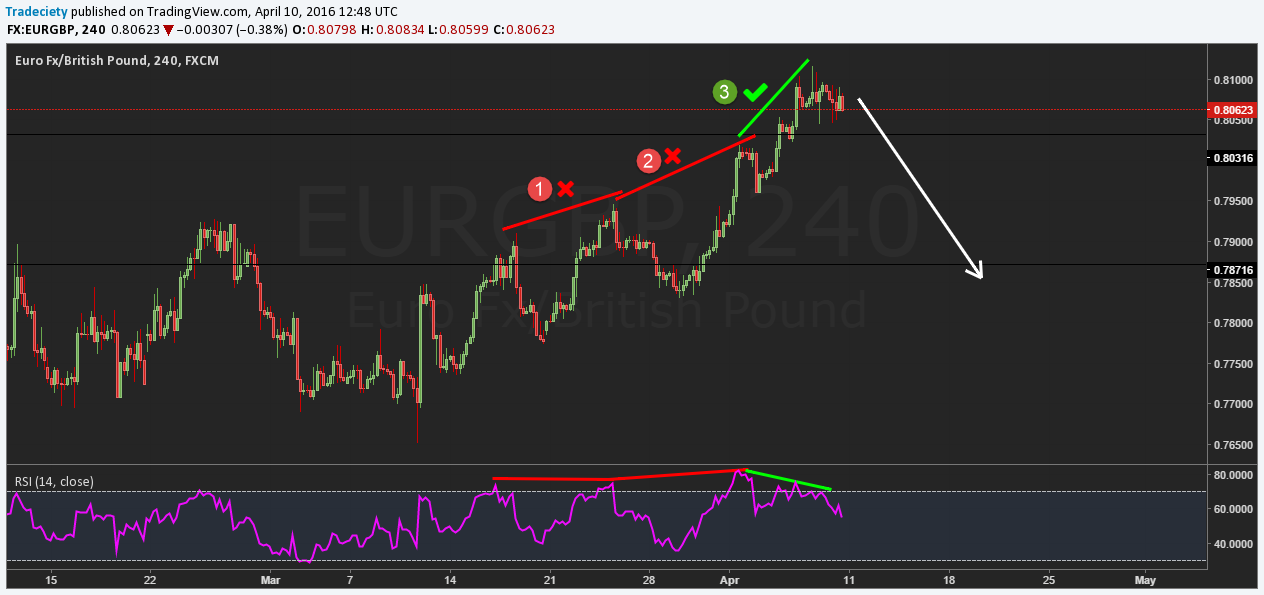
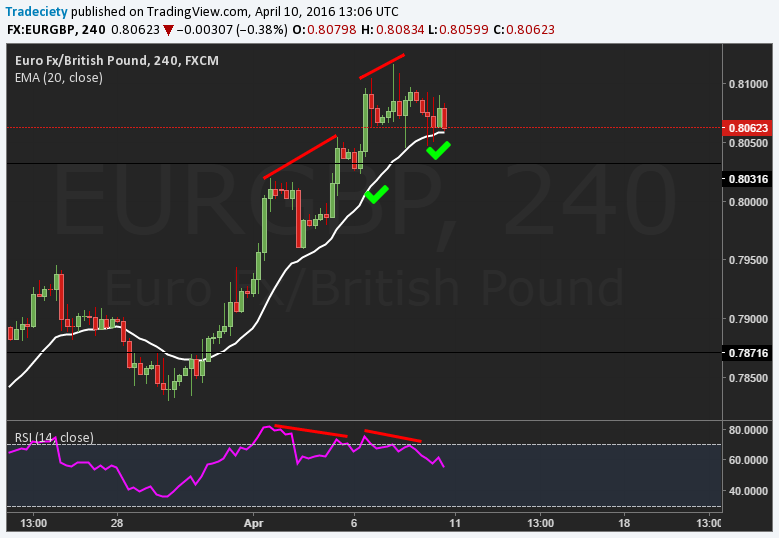
Below we see how price made 2 divergences but price never sold off. The divergences, thus, just highlighted short-term consolidation.
Location is a universal concept in trading and regardless of your trading system, adding the filter of location can usually always enhance the quality of your signals and trades. Instead of taking trades just based on a divergence signal, you’d wait for the price to move into a previous support/resistance zone and only then look for divergences and trend shifts to time entries.
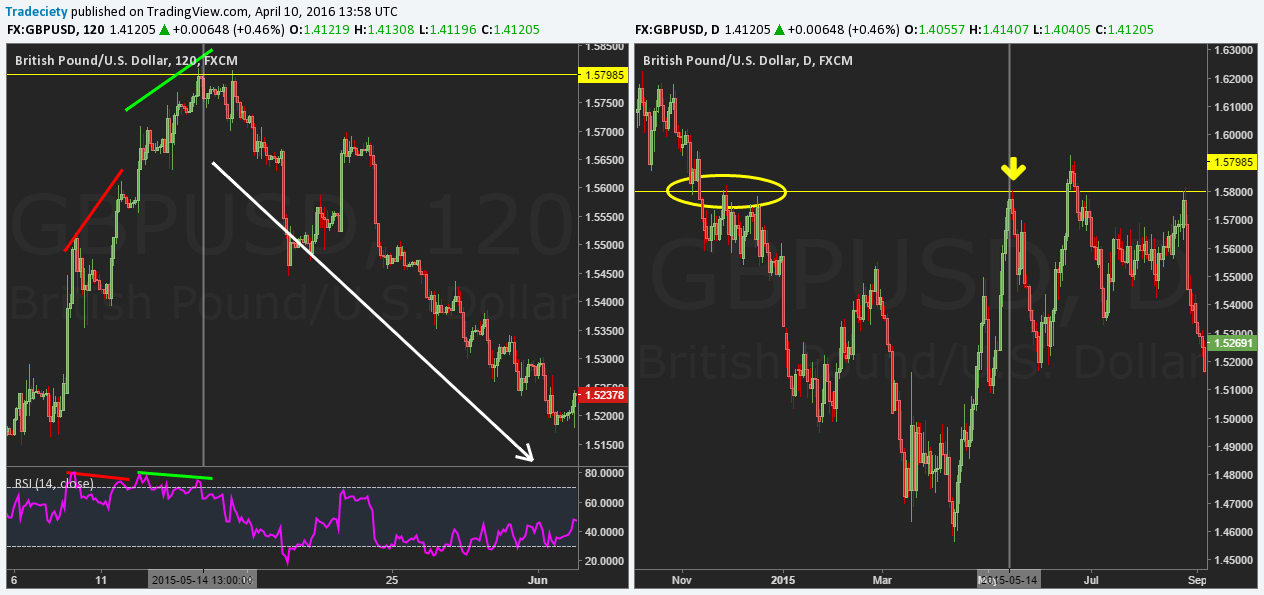
The screenshot below is a great example: On the left side, you see an uptrend with two divergences. However, the first one completely failed and the second one resulted in a massive winner. What was the difference? When we take a look at the higher time frame on the right we see that the first divergences happened in the middle of nowhere and the second divergence formed at a very important resistance level (yellow line and yellow arrow). As a trader, you first identify your support/resistance zones and then let price come to you. Such an approach will impact your performance in a big way.
Divergences are a powerful trading concept and the trader who understands how to trade divergences in the right market context with the correct signals can create a robust method and effective way of looking at price.

external link:


We have been trading supply and demand strategies for over ten years, and they have stood the test of time remarkably well. Supply and demand is...

3 min read
Choosing the right trading journal is essential for traders wanting to analyze performance, refine strategies, and improve consistency. In this...

3 min read
“95% of all traders fail” is the most commonly used trading related statistic around the internet. But no research paper exists that proves this...