Supply and Demand Trading in 2026
We have been trading supply and demand strategies for over ten years, and they have stood the test of time remarkably well. Supply and demand is...
The Average True Range indicator (ATR) is a very popular trading indicator that can be used in many different trading situations. The ATR may be beneficial for trend-following trading, improve your understanding of market behavior, and may even help to optimize target placement to improve a trader´s winrate.
This guide will first explain the idea behind the ATR indicator and then explore the different use cases.
The ATR is a volatility indicator which means that it measures price fluctuations. This is in stark contrast to other trend and momentum indicators such as the RSI or the STOCHASTIC indicator. This is also why the ATR may be a great additional confluence tool to provide a different way of looking at price movements and complement your price analysis.
I won’t bother you with math formulas but I strongly believe that a trader must understand how their indicators are being created and what makes them go up or down in order to make the right trading decisions. It’s pretty easy, though, as we will see.
ATR stands for Average True Range which means that the ATR measures how much the price moves on average. In essence, the ATR measures the candle size and the range of price movements.
Below I set the ATR to 1 period which means that the ATR just measures the range/size of one candlestick.
The relationship between the candle size and the ATR becomes very clear this way. The larger the candle, the higher the ATR is. The smaller the candle, the lower the ATR is.
The ATR looks at the total range of a candlestick, including the wick.
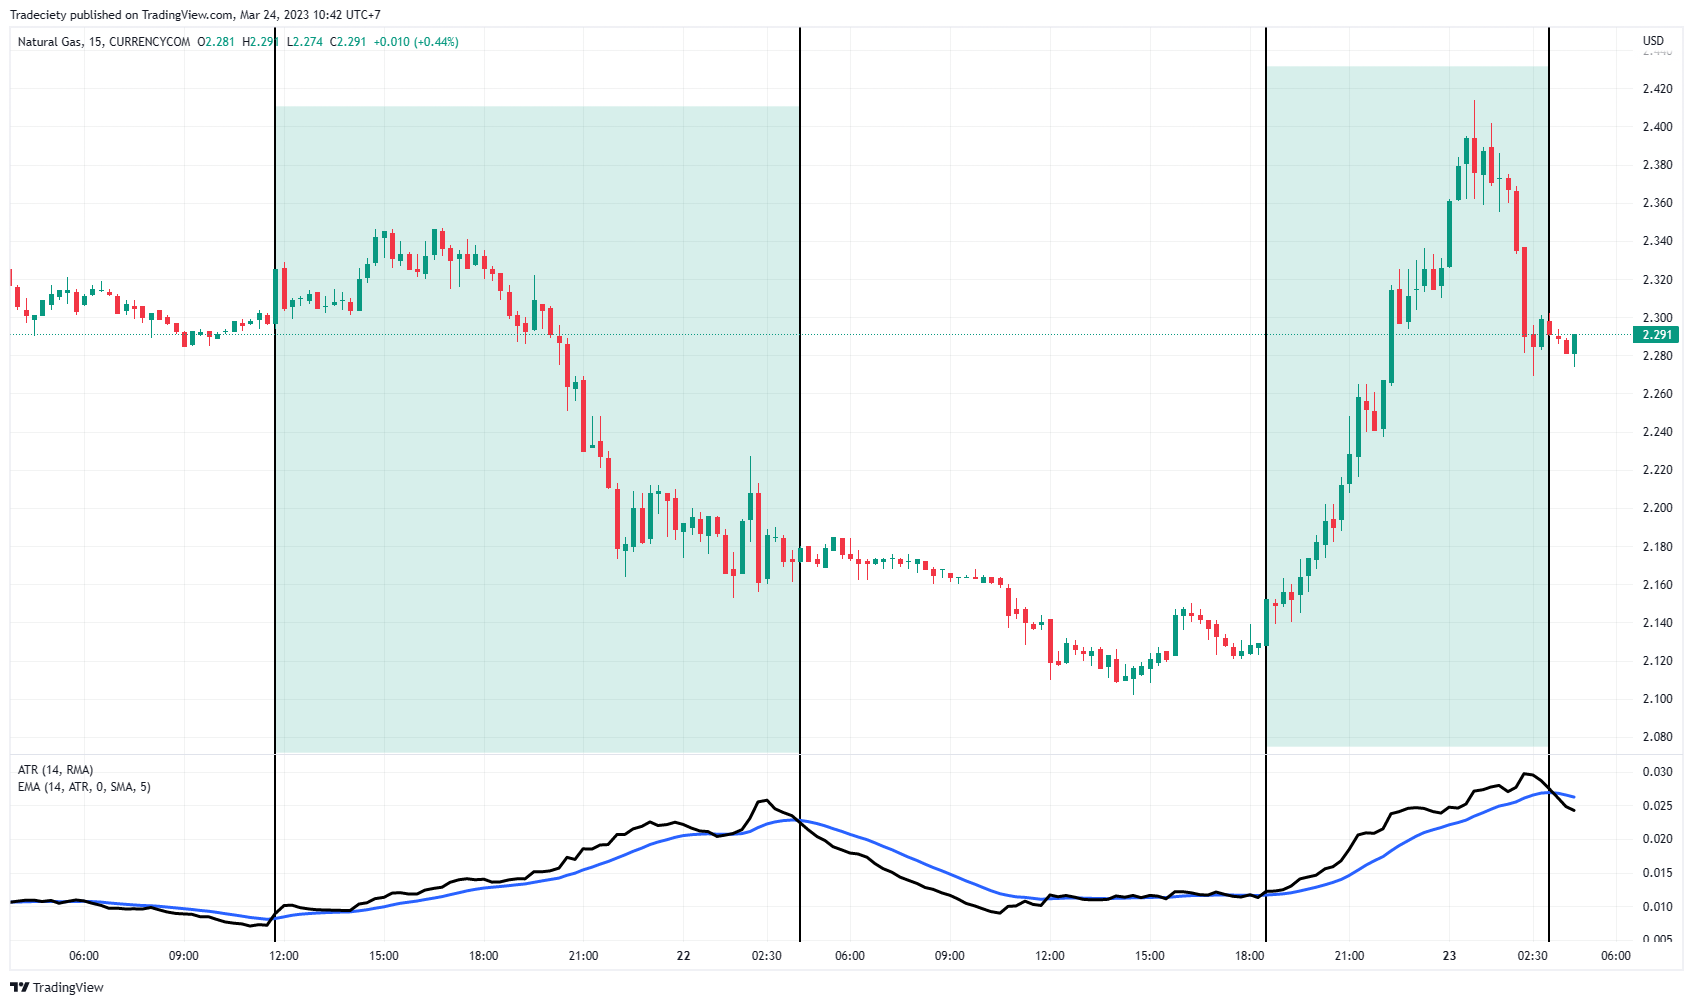
The ATR is typically set to 14 periods which means that the ATR looks at the range of candlestick size over the last 14 candlesticks. The screenshot below shows the standard 14-period ATR. The highlighted periods show relatively small candlesticks which lead to a low and/or declining ATR. When the candlesticks increase in size, the ATR also increases.

Of course, this is a very simplistic way of looking at the ATR, and math-wise, there is a little more that goes into the calculation of the ATR. But for the average trader, knowing the relationship between candle size (range) and the ATR value is sufficient.
Traders often mistakenly believe that volatility equals trend momentum. However, volatility does not say anything about the trend strength or the trend direction. Volatility shows how much the price fluctuates back and forth.
Volatility = How much the price fluctuates around the average price. In a high-volatility environment, price candles are usually larger and exhibit longer wicks.
Momentum = Momentum describes the trend strength in one direction. In a high-momentum environment, you typically see only one color of candles (very few candles moving against the trend), and smaller candle wicks against the trend direction.
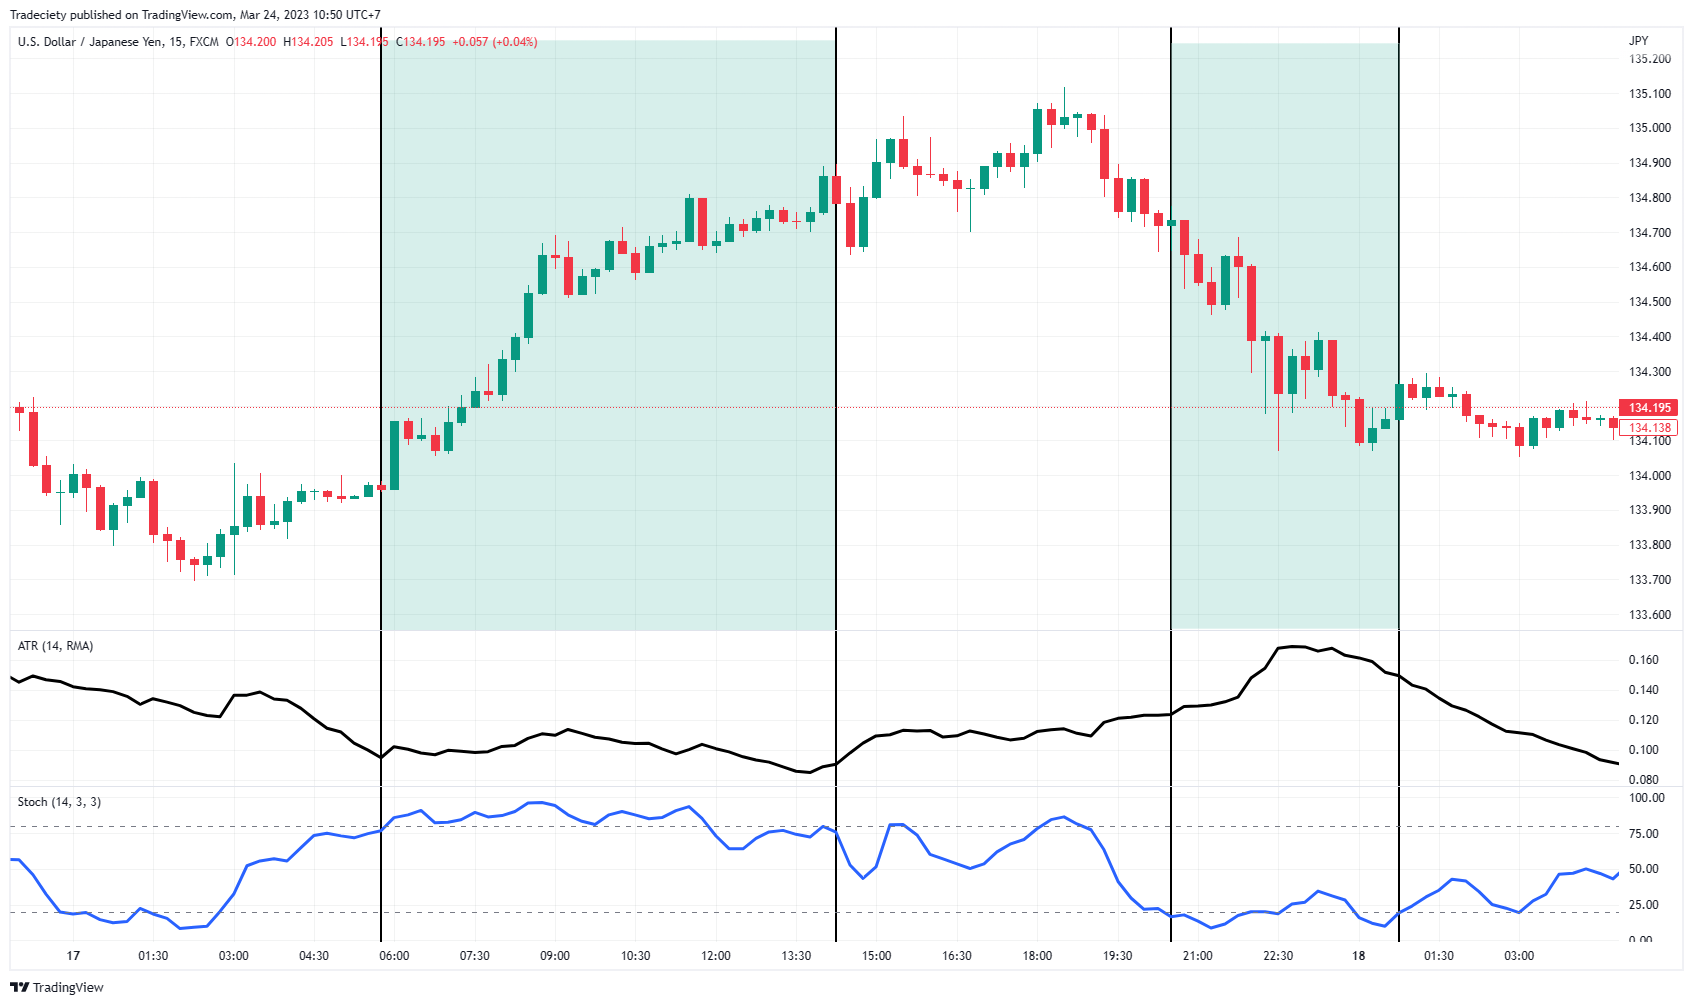
In the screenshot below, the ATR and the STOCHASTIC indicator are used to show the difference between momentum and volatility. Whereas the ATR is used to measure volatility, the STOCHASTIC is a pure trend strength indicator.
The price was in a bullish trend during the first highlighted phase. The STOCHASTIC (lower indicator window) was above the 80 level, confirming a strong bullish trend. Because of the absence of large wicks and the orderly trend behavior, the ATR was at a low value. This shows a low volatility and high momentum trending market.
During the second highlighted phase, the price was in a downtrend. The STOCHASTIC confirmed the strong bearish trend strength and it dropped below the 20 line. This time, however, the candlestick wicks were much larger during the bearish trend and the trend was not as orderly as in the previous bullish trend. This led to a much higher ATR.
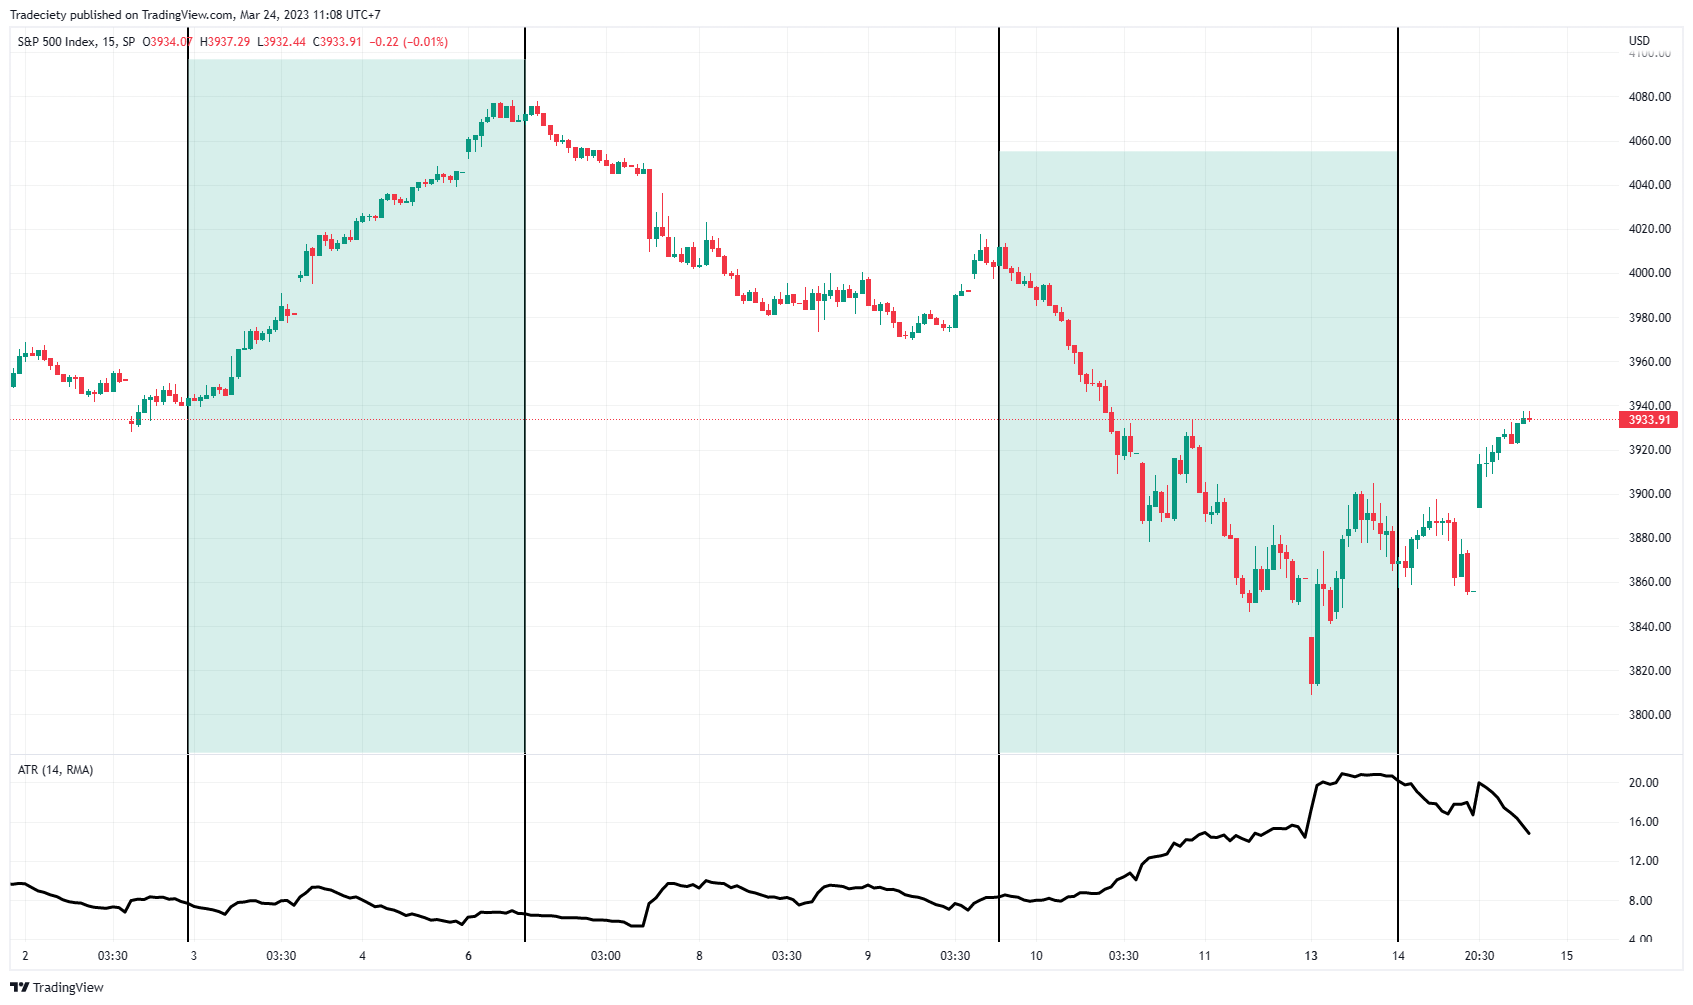
Interestingly, different markets may provide different characteristics when it comes to the manifestation of volatility during trending markets. The screenshot below shows the S&P500 and whereas uptrends often happen with a low(er) ATR, downtrends often - not always - happen in a more extreme fashion and, therefore, show a much higher level of volatility.
That´s where the old saying "Stocks take the stairs on the way up and the elevator on the way down" comes from.
Such insights can be very valuable to traders when it comes to optimizing their decision-making. Trend-following trading during high volatility trends may require a different approach when it comes to stop trailing and trade management, for example. Also, changes in volatility levels may foreshadow a change in market and trend structure as well.
Changes in volatility can also foreshadow changes in market sentiment.
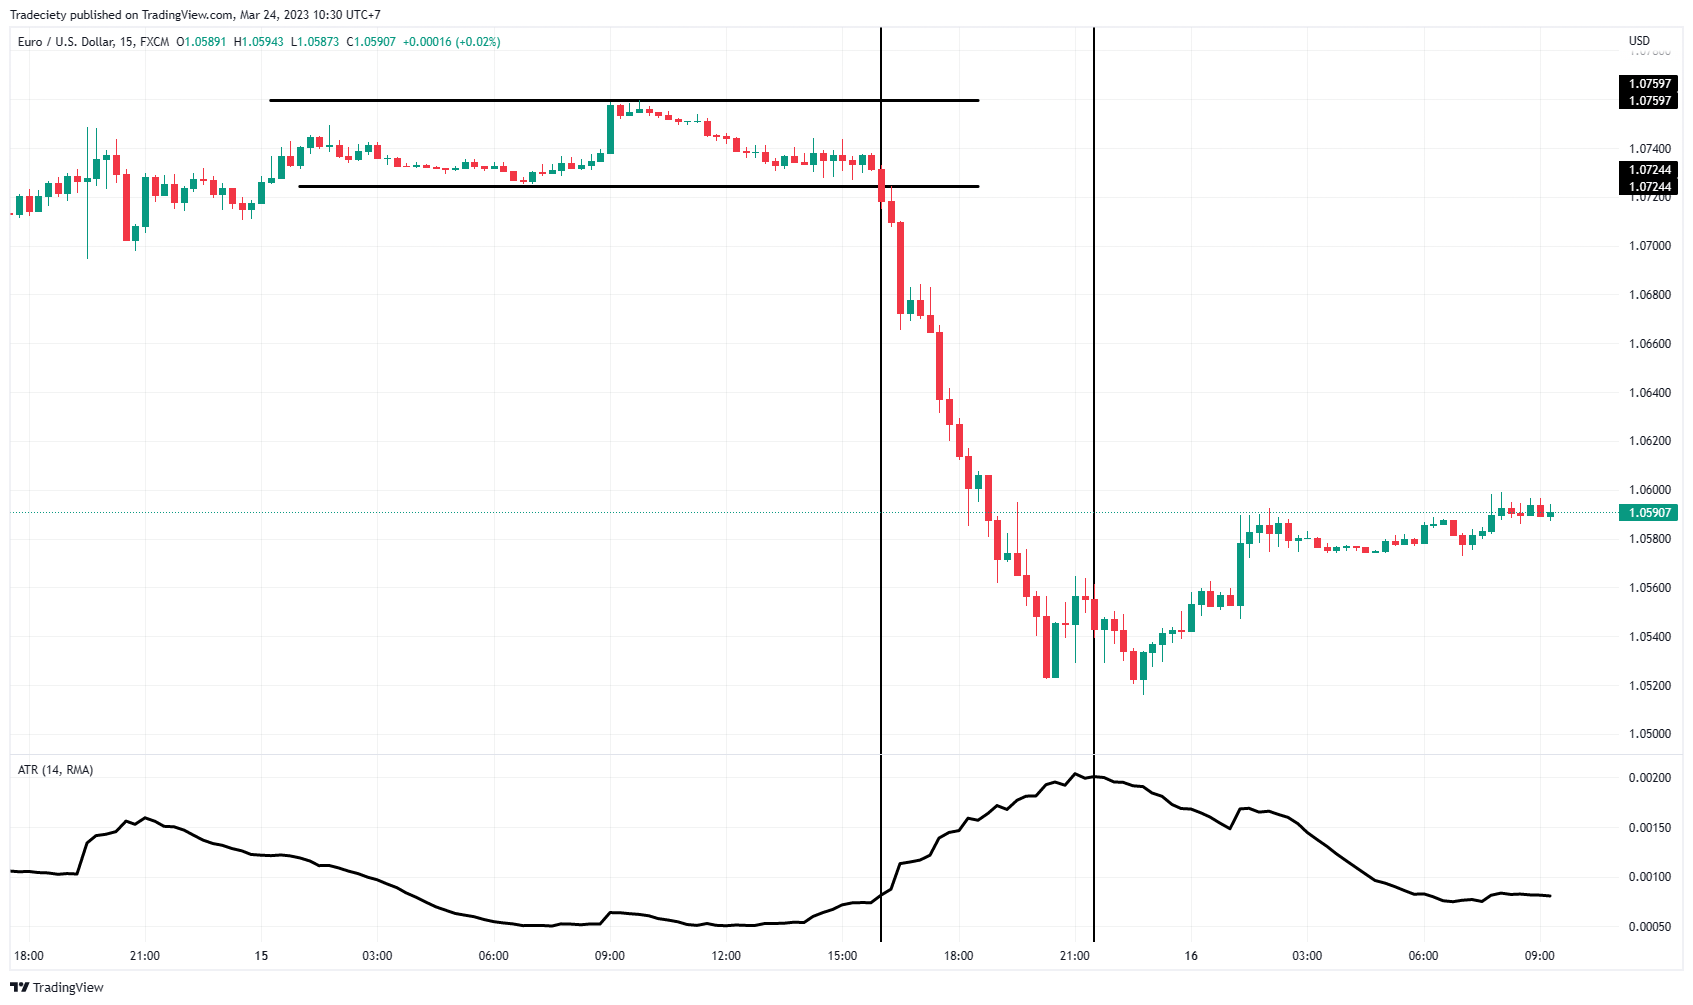
A narrow range is a low-volatility market phase. The two horizontal lines in the screenshot below define the sideways range in the scenario below. The small candles and the absence of large wicks result in a low ATR.
The breakout below the lower range support occurs as the ATR starts rising because the candles got larger. During the following bearish market phase, the ATR keeps rising throughout the whole trend.
As the bearish trend comes to an end, the ATR also reached its peak. As the ATR declined, the trend also stopped going lower.
The ATR can be a great confluence for trend-following traders in such a case. Although the ATR is not a trend-following tool, changes in volatility can point to changes in market behavior.
Adding an exponential moving average (EMA) to the ATR can provide interesting insights and offer an objective use case. The EMA is the blue line in the ATR window below.
The highlighted areas on the price chart below show periods during which the ATR is above the EMA. Both phases showed strong trending markets.
When the ATR is below the EMA, the trend was reversing. And when the ATR and the EMA were on top of each other, clustering together, the price was in a narrow sideways period.
Therefore, understanding changes in ATR structure may be beneficial for traders to correctly identify changes in price and trend structure.
Another popular use case for the ATR is to look for exhausted price movements. Since the ATR tells us the average range the price has moved over a given period, we can use this information to estimate the likelihood for trends to continue or stall.
You may have noticed that markets move differently and some markets tend to trend significantly more and longer than others. A look at the daily pip variation in the table below shows that there can be significant differences between different Forex pairs.
The AUD/JPY, for example, moves roughly twice as much as the CAD/CHF.
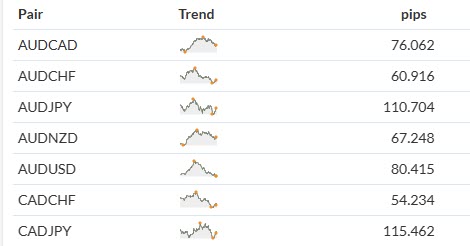
source: Mataf Forex volatility
Traders can use the information on daily price fluctuations in different ways:
1. Market selection
Instruments with a higher average range may provide trading opportunities that may lead to capturing larger winning trades. Thus, staying away from instruments with extremely low average pip ranges can be a filter criterion in market selection.
2. Target placement
By knowing that the AUD/JPY moves on average 110 pips per day, traders can use this information for their target placement. Utilizing a target that is 150 or even 200 pips away from the daily open may provide a lower chance of successfully closing a winning trade because the market does not move as much typically. A target that is only 80 points away may lead to a higher chance of realizing a winning trade in such a case.
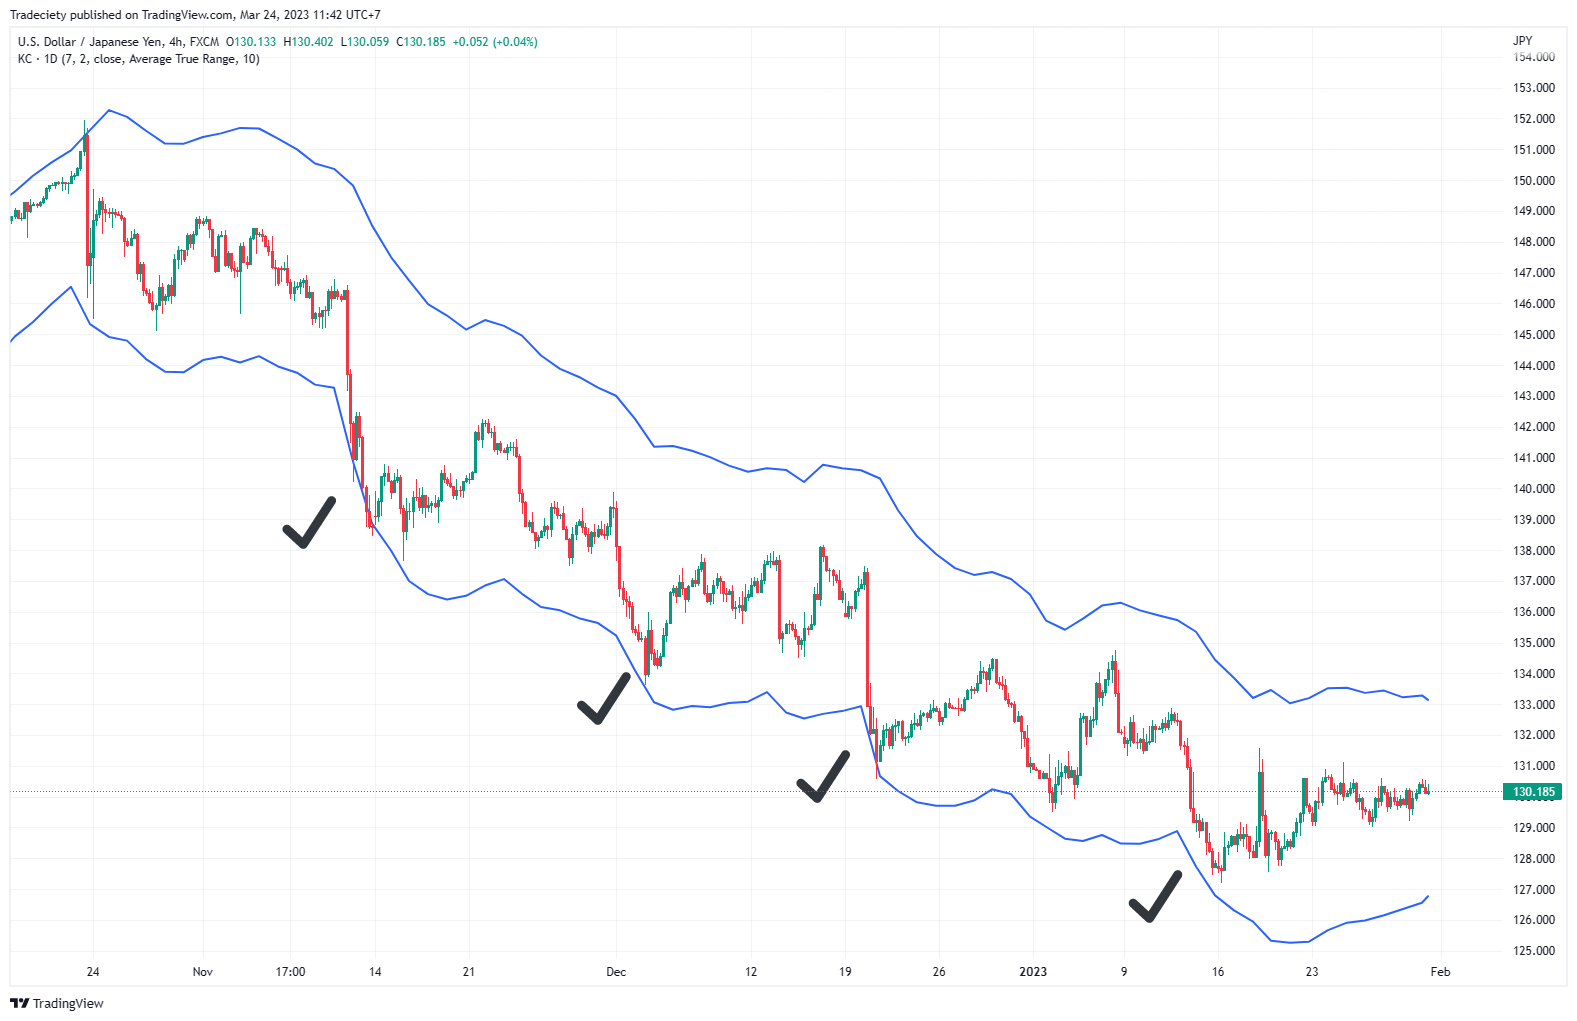
The Keltner channel is a popular trading indicator that can be used in this context effectively. The Keltner channel plots the ATR bands around the price action.
In the screenshot below, the Keltner channel shows the average pip range over the last 7 days.
During the downtrend, the impulsive bearish trend waves often end right at the lower ATR band where the price has exhausted its average price range.
Targeting price levels at, or close to, the ATR bands may improve target placement for trend-following traders.
3. Trend continuation trading
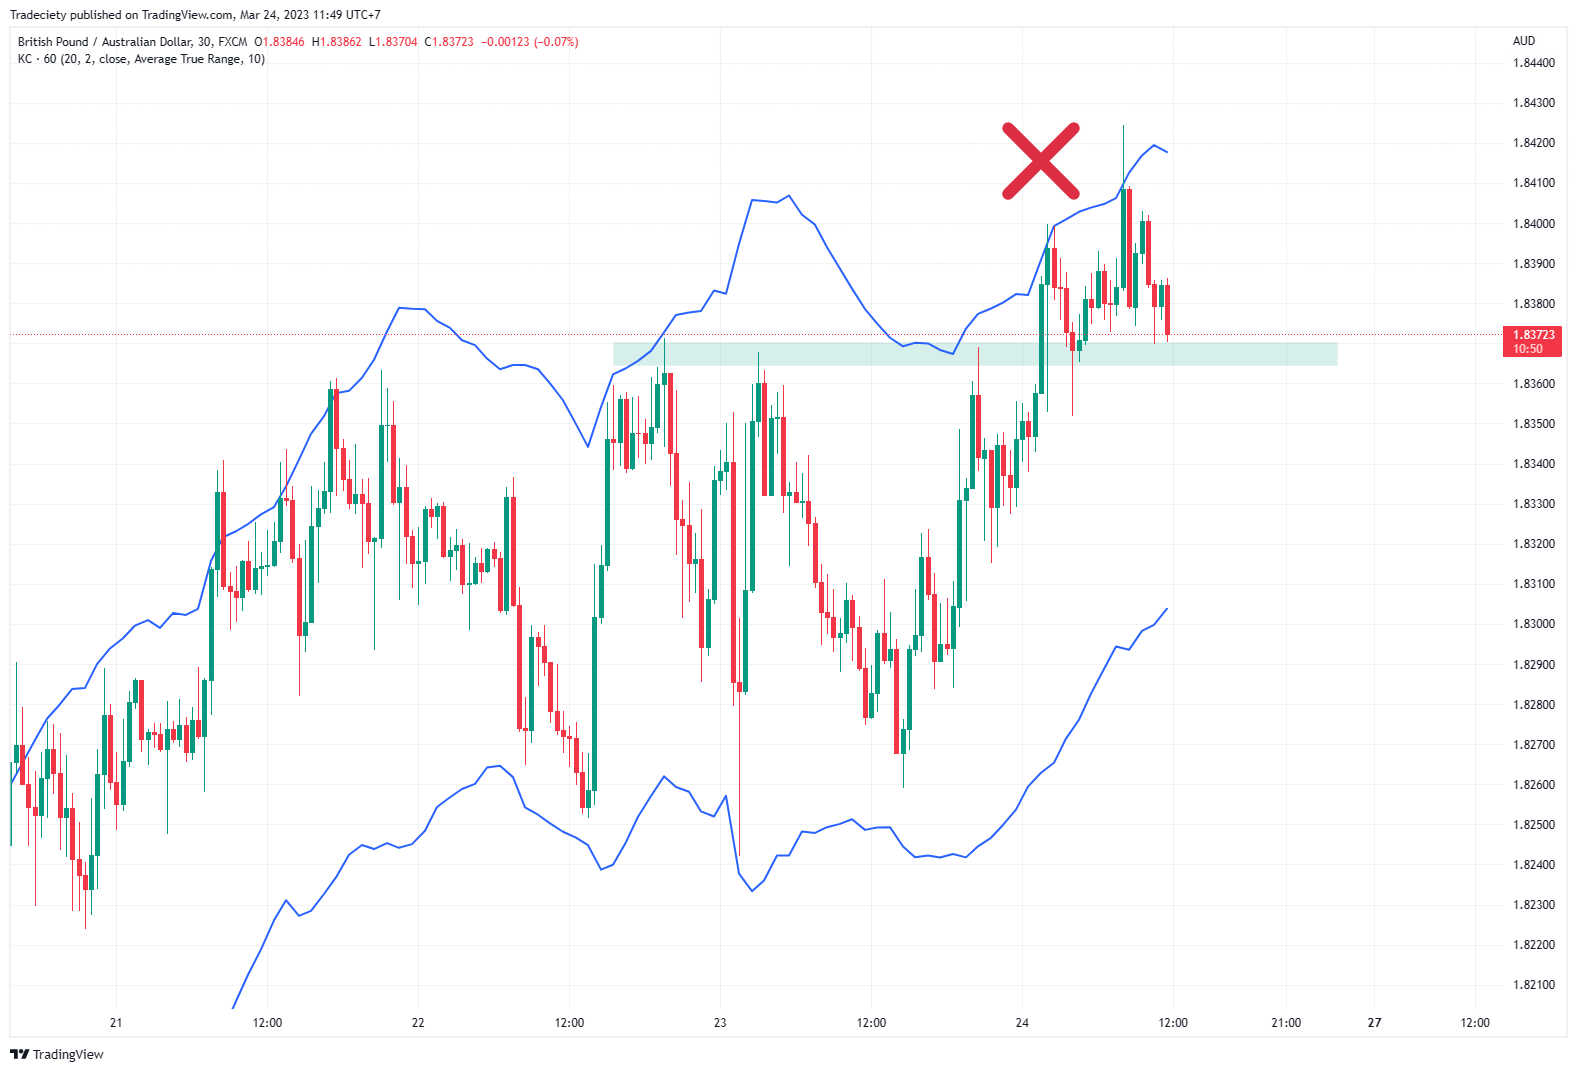
Another use case for the ATR-based Keltner channel is to estimate the likelihood of a trend continuation. For example, a breakout that occurs close to the Keltner channel may have a much lower chance of resulting in a long-lasting trend continuation.
In the screenshot below, the price broke above the resistance zone first. However, the price was already close to the higher Keltner channel at the time of the breakout because the bullish trend had already been going on for a while. Expecting further bullish trend continuation moves may not be a high-probability play in such a situation.
The ATR is a universal trading indicator that can be used in many different situations and use cases.
For trend-following traders, the ATR can provide useful information about the market structure. Changes in volatility often also may foreshadow changes in trending behavior. Furthermore, trend-following traders may also be able to optimize their target placement by using the ATR-based Keltner channel.
But the ATR can also provide general information about the underlying level of volatility of a market or the average price range for a specific period.
Overall, the ATR may be a great addition to a wide variety of trading strategies and prove effective in enhancing price analysis.
external link:


We have been trading supply and demand strategies for over ten years, and they have stood the test of time remarkably well. Supply and demand is...

3 min read
Choosing the right trading journal is essential for traders wanting to analyze performance, refine strategies, and improve consistency. In this...

3 min read
“95% of all traders fail” is the most commonly used trading related statistic around the internet. But no research paper exists that proves this...