Supply and Demand Trading in 2026
We have been trading supply and demand strategies for over ten years, and they have stood the test of time remarkably well. Supply and demand is...
The Relative Strength Index, or RSI indicator is among the most popular indicators used by traders. The RSI provides information about the strength of the price movements on your charts, hence the name. In this article, we will learn what the RSI really does, how to understand the information it provides and how to use it in our trading.
The standard setting for the RSI is 14 periods which means that the RSI evaluates the last 14 candles, or time periods.
The RSI compares the average gain and the average loss and analyses how many of the past 14 candles were bullish versus bearish and it also analyses the candle size of each candle.
For example, if all 14 price candles were bullish, the RSI would be 100 and if all 14 price candles were bearish, the RSI would be 0 (or relatively close to 100 and 0). And an RSI of 50 would mean that 7 past candles were bearish, 7 were bullish and the size of the average gain and loss was equal. The more candles were bullish than bearish, the higher the RSI generally speaking is.
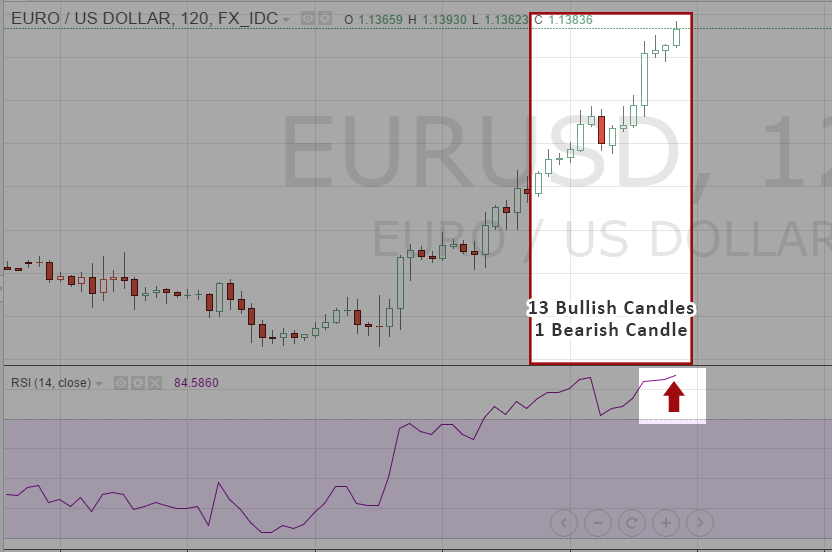
The white highlighted area includes the past 14 price candles which the RSI analyzes. Out of those 14 candles, 13 were bullish and only 1 was bearish which resulted in a RSI of 85.
 click to enlarge
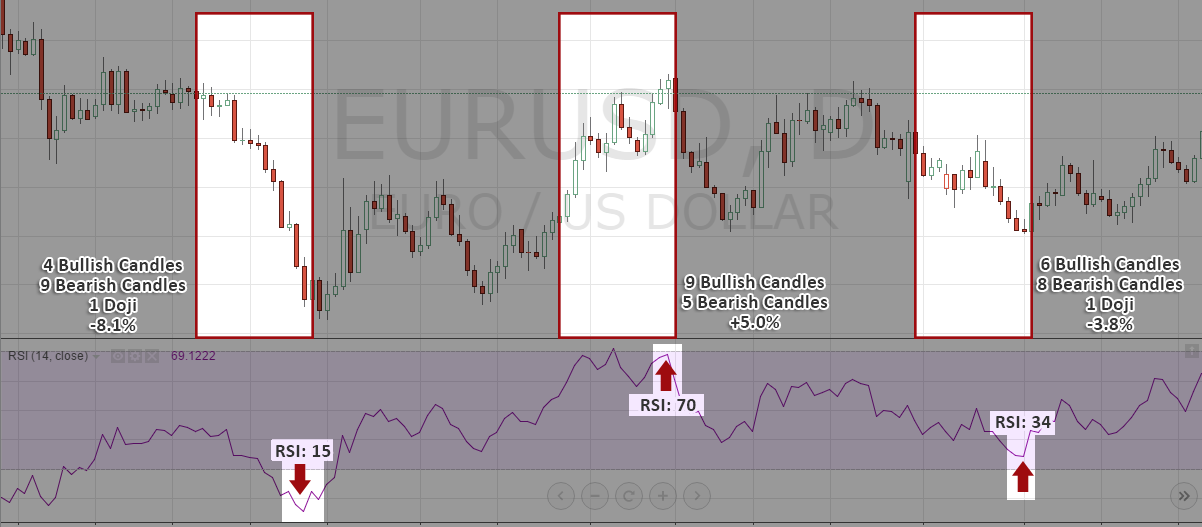
Here are 3 more case studies to help us understand the RSI and how it forms:
As you can see, just by analyzing the 14 candles you would be able to very accurately guess the RSI for a given period. However, using an indicator can still be beneficial because it takes out the guesswork and you can process the data faster.

click to enlarge
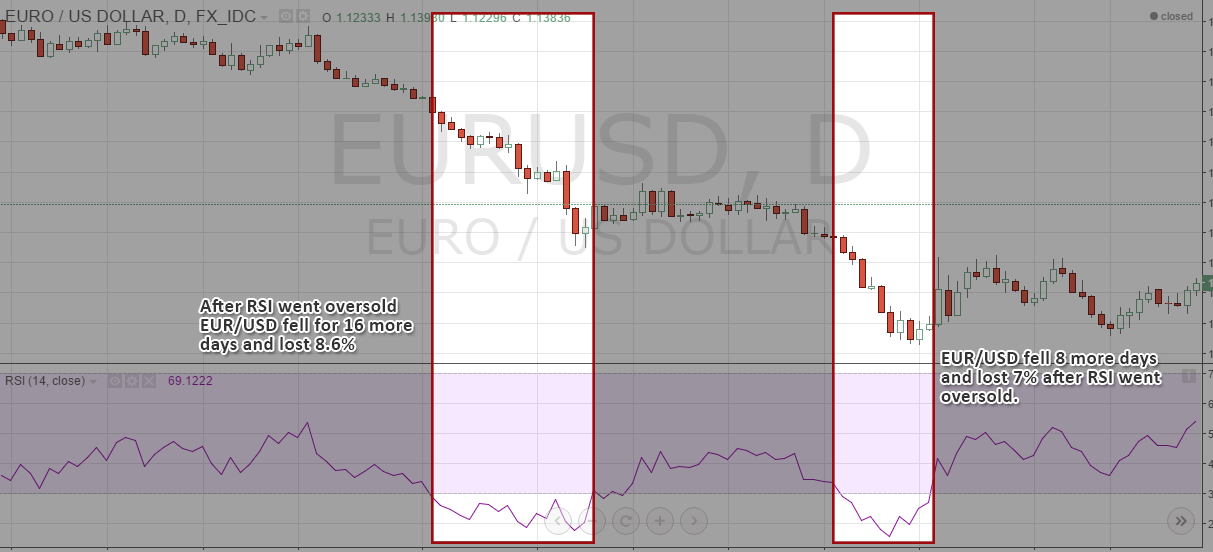
The general idea is that when the RSI shows extremely high or extremely low values (higher than 70 or lower than 30), price is said to be oversold or overbought. But, let’s recap what we have just learned to see if this is really true:
A high RSI simply means that there were more bullish candles than bearish candles. And although price can’t go on printing only bullish candles forever, it can be dangerous to believe that just because the RSI shows overbought conditions that the price is likely to reverse. Once we understand what the RSI does, we can see that overbought and oversold and NOT signals that indicate that price will turn.
It’s a myth and it shows misinformation when traders refer to overbought and oversold to define markets which will reverse!
Let’s take a look at some chart studies:
click to enlarge
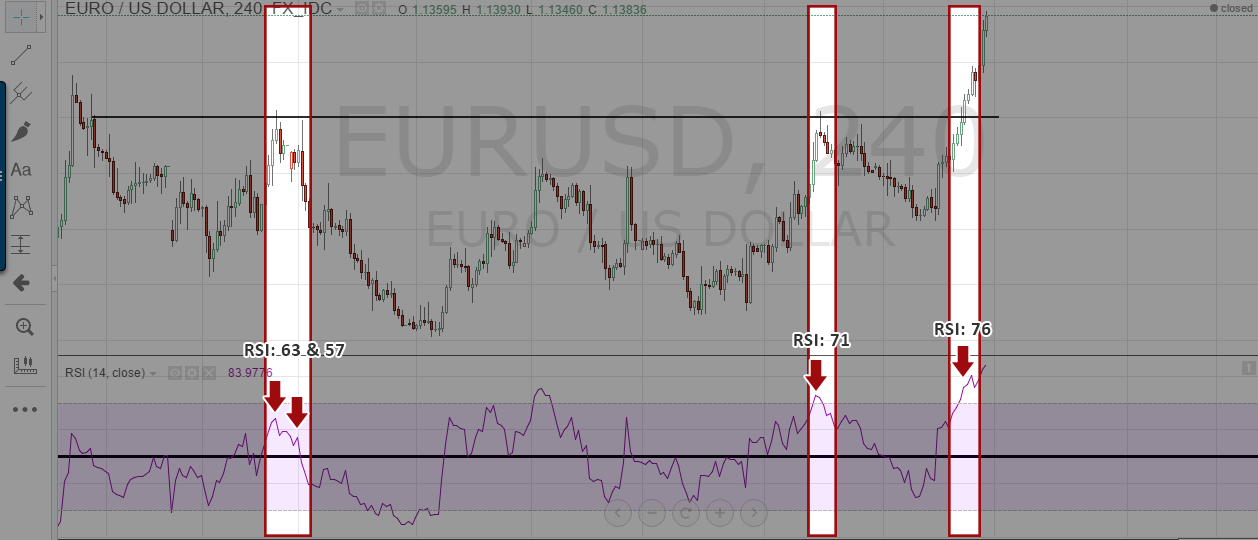
We have just discovered that the RSI identifies strong trending price movements when it moves at the extremes. And with this knowledge the RSI can be used when it comes to support and resistance and breakout trading. The screenshot below shows with a strong resistance level marked in black. Now let’s observe what happened when price traded into the level.
You can see that price went back to the level several times. During the first time, the RSI showed values of 63 and 57 which meant that although the power was more bullish than bearish, the bulls were not in full control. A strong resistance level does usually not break easily and it requires a strong trend to make it past the price barrier.
The second time price went back to the level, the RSI was at 71, indicating a fairly strong bullish trend, the resistance level held again. It wasn’t until the last time when the RSI showed a value of 76 that the resistance level broke and price held above it with the RSI going all the way to currently 85.
click to enlarge
The RSI can be a useful tool when it comes to quantifying price strength because that is what the RSI does: it analyzes momentum and price strength.
And, finally, another way of using the RSI to identify turning points is by finding divergences. A divergence signals that what price is showing you, is usually not supported by the underlying price dynamics – we will see what this means now.
Let’s follow the price action and we will see how a RSI divergence can be a great way of making sense of trend strength.
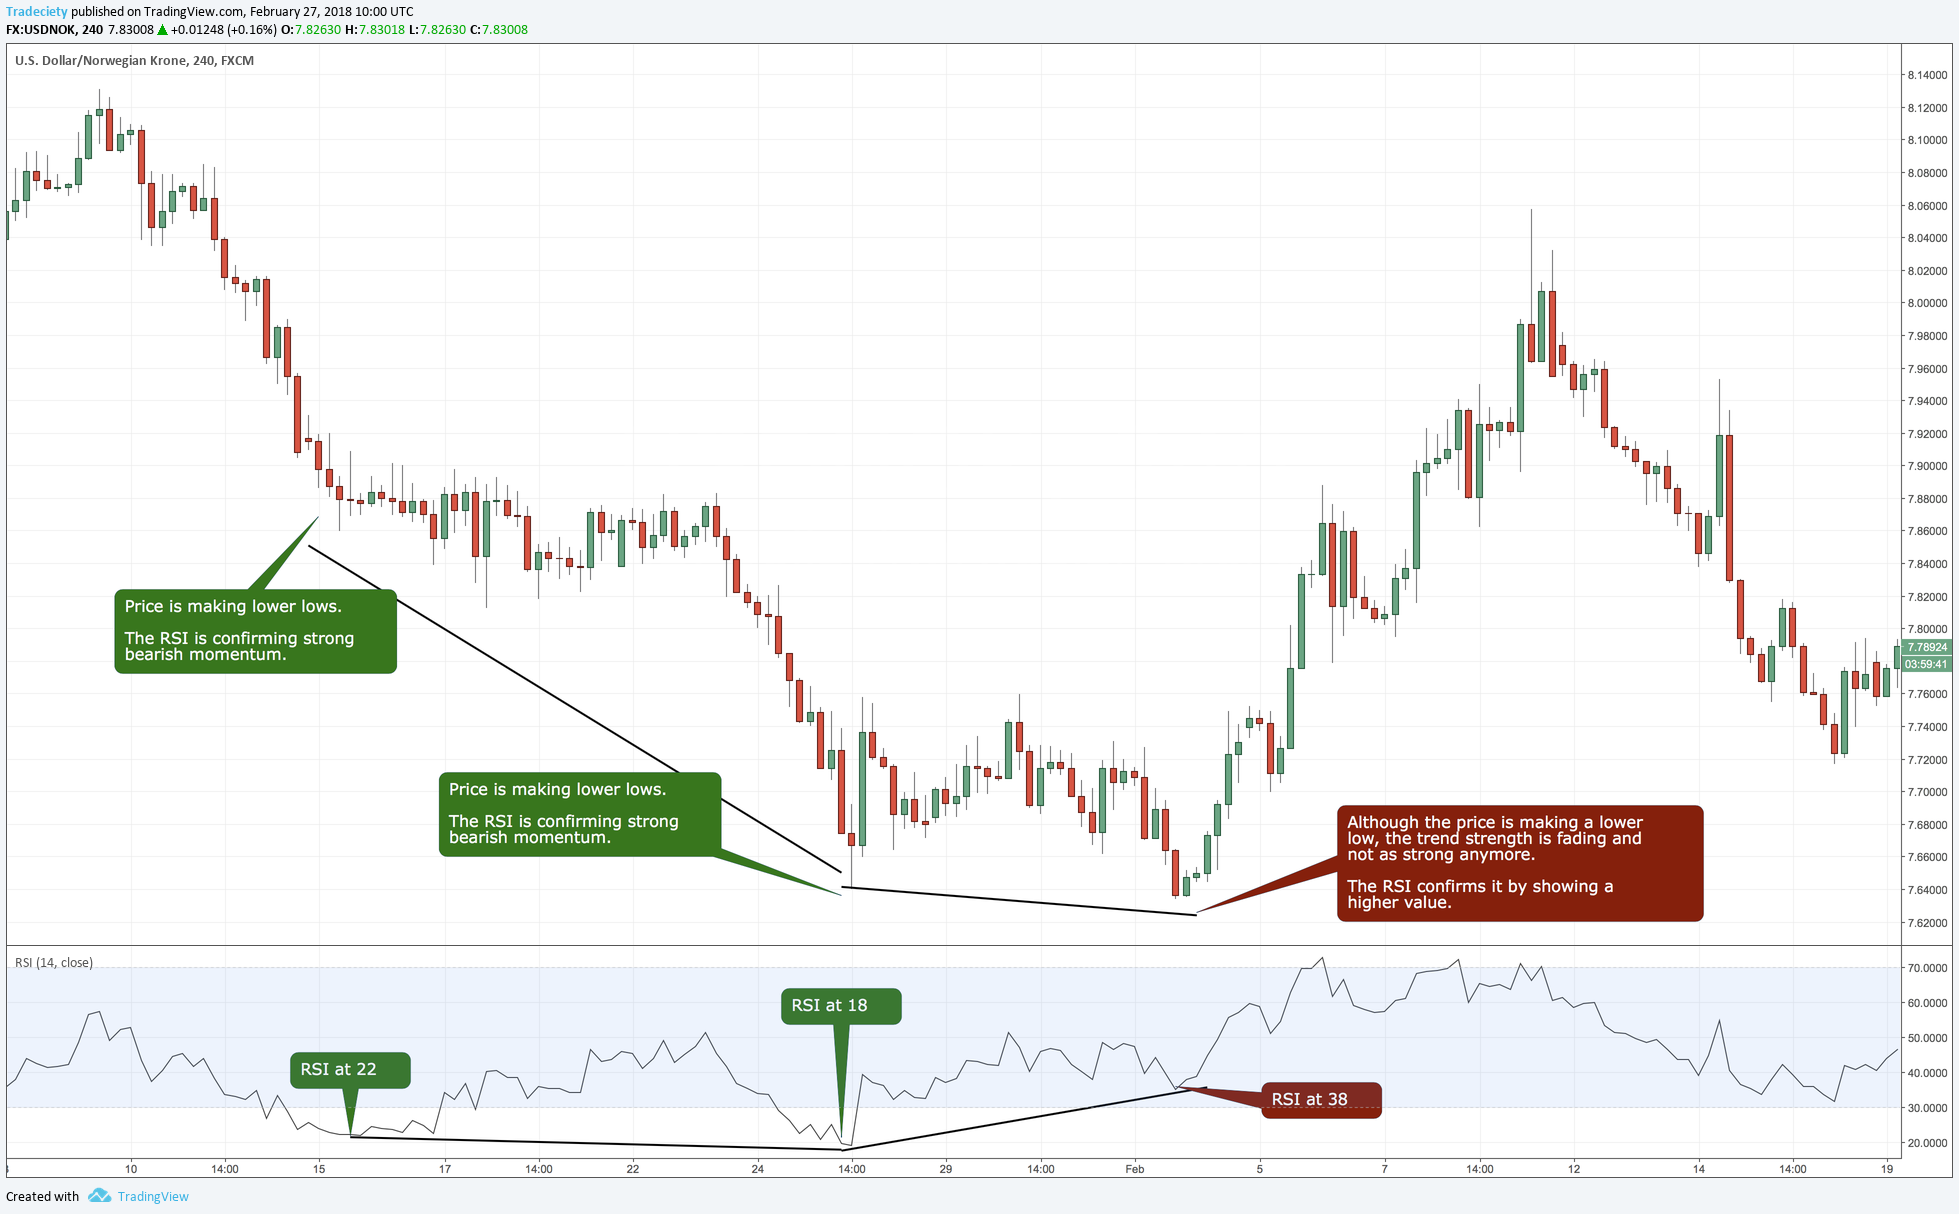
First, we see that the downtrend is strong and clearly defined by lower lows and lower highs. The RSI confirms that by showing a lower RSI when it fell from 22 to 18 which means that the downtrend was accelerating.
Then, although price made a new lower low, we can already see that the price wasn’t able to push as low anymore and price just barely broke the previous low. The RSI confirmed that by showing a higher RSI and a value of 38 which means that during the last bearish trend wave, the sellers weren’t as strong.
When the price action and the indicator show opposite signals, we call that a divergence. A divergence can help us understand that trend strength is fading and that one side of market participants are slowly leaving the arena.
The RSI is a great tool and although you could easily guess the RSI value by looking at the past 14 candles, plotting the RSI on your charts can add stability and guidance to your trading. If you can quantify price strength and translate it into interpretable numbers, you can make trading decisions more effectively and avoid guesswork and subjective interpretations.
Whether you are using the RSI to identify strength, look for turning points or as a breakout trader, the RSI is your universal weapon.

external link:


We have been trading supply and demand strategies for over ten years, and they have stood the test of time remarkably well. Supply and demand is...

3 min read
Choosing the right trading journal is essential for traders wanting to analyze performance, refine strategies, and improve consistency. In this...

3 min read
“95% of all traders fail” is the most commonly used trading related statistic around the internet. But no research paper exists that proves this...