3 min read
A Year with "The Trading Mindwheel": Transforming Trading Through Psychology
The following is a guest post from Michael Lamothe.
I'm Michael Lamothe, and today marks an extraordinary milestone: the first anniversary of "The...
When trading the breaks of support or resistance, be that horizontal (what people call S/R) or diagonal (trendlines and chart pattern boundaries), there are a few things to know that can help a lot. Generally, I favor breaks of horizontal S/R over diagonal S/R because they tend to be cleaner and show more immediate follow through, however, there are a few tricks that can make trading diagonal S/R breaks just as effective.
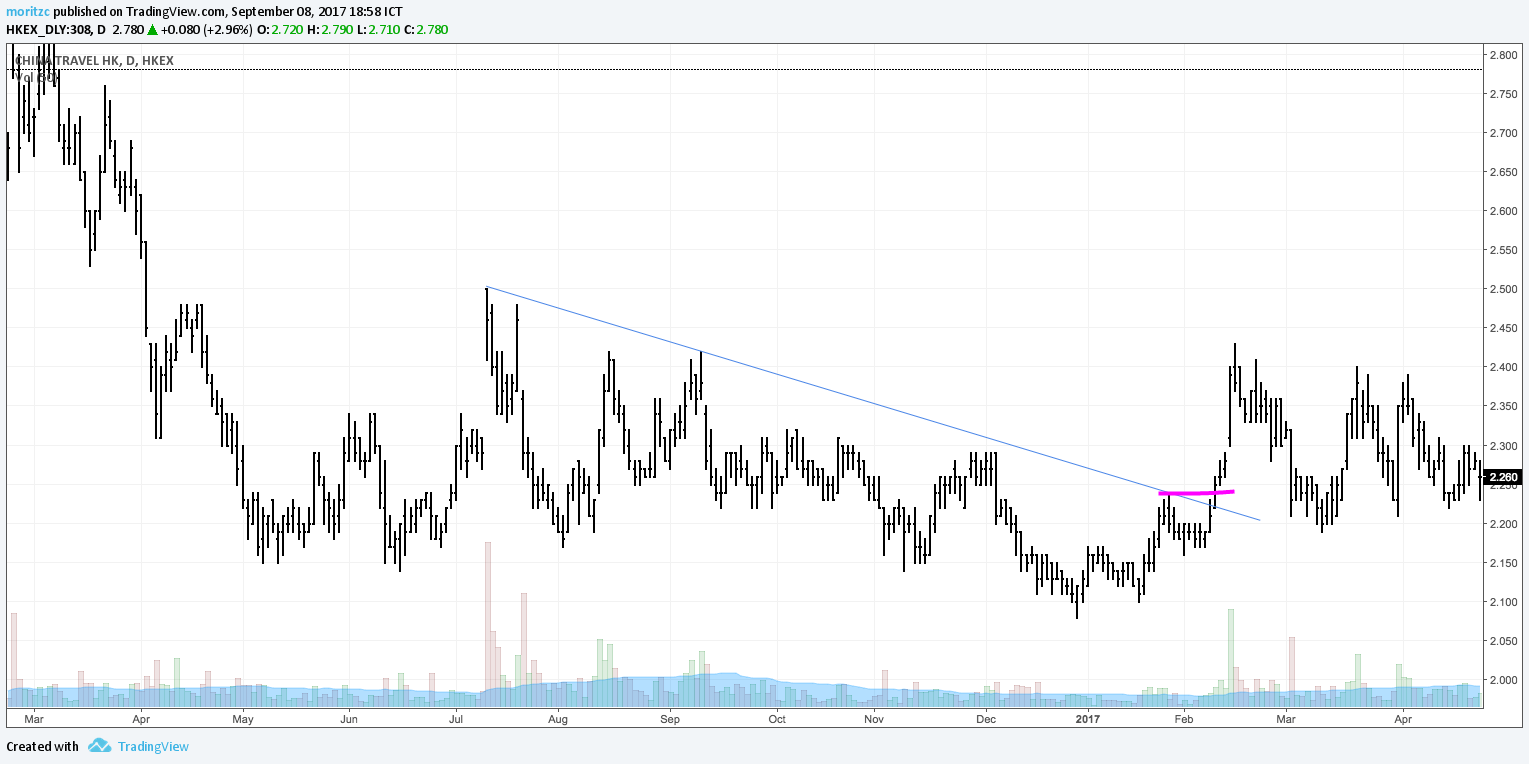
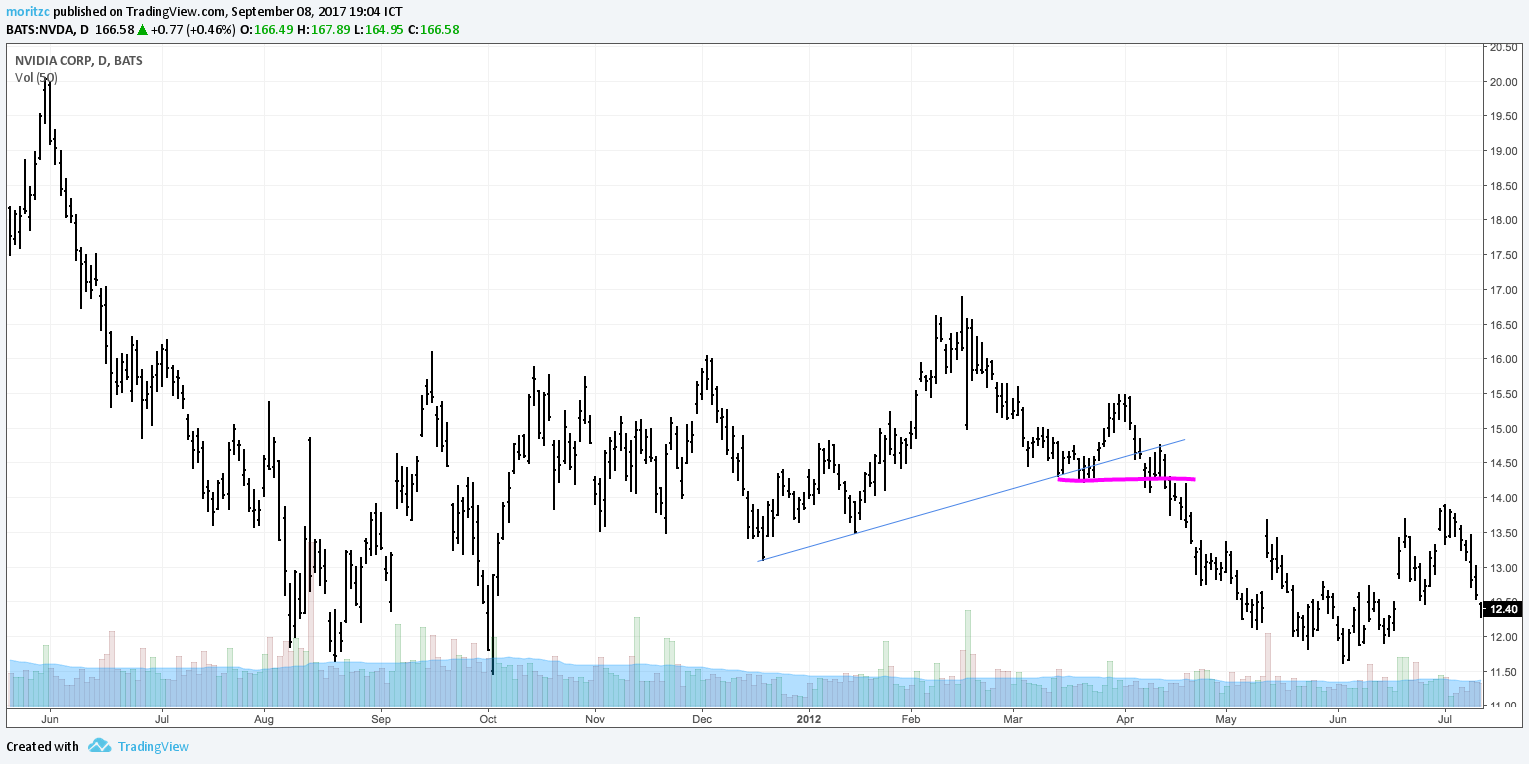
There are two ways to trade breakouts, either on the breakout or when the retest happens (if it happens). Let’s take a look at two breakouts, first horizontal, then diagonal.
As you can see, in the first example price took off, in the second example it retested our pattern line. Now this doesn’t mean that price retests diagonal boundaries more often than horizontal boundaries, I have no statistics on that. But what I do know is that retests of horizontal boundaries are much easier to trade than retests of diagonal boundaries, PLUS – and this is important – when trading diagonal boundaries, we have a chance that the chart pattern we just broke out of will morph into a new chart pattern – and that is a problem.
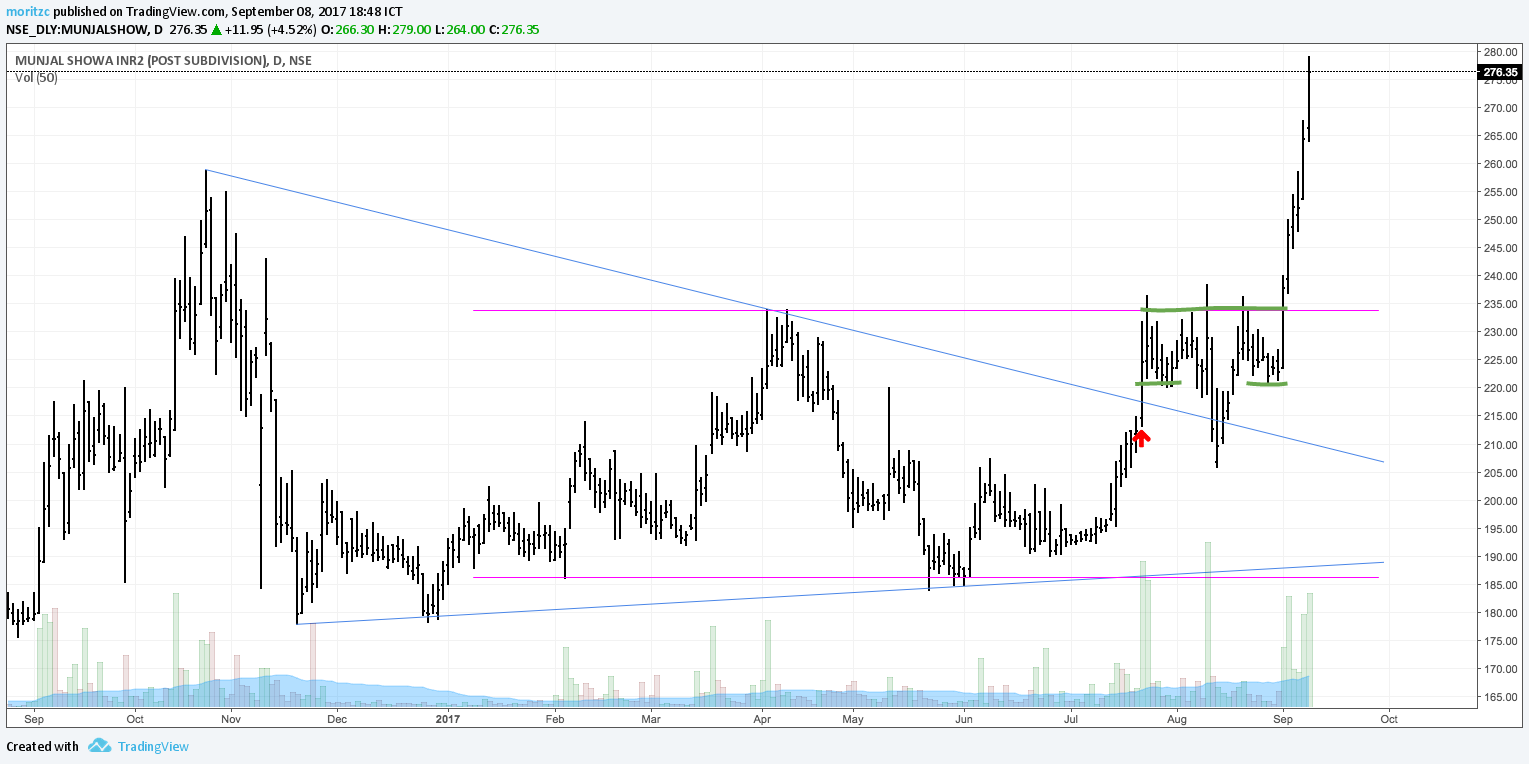
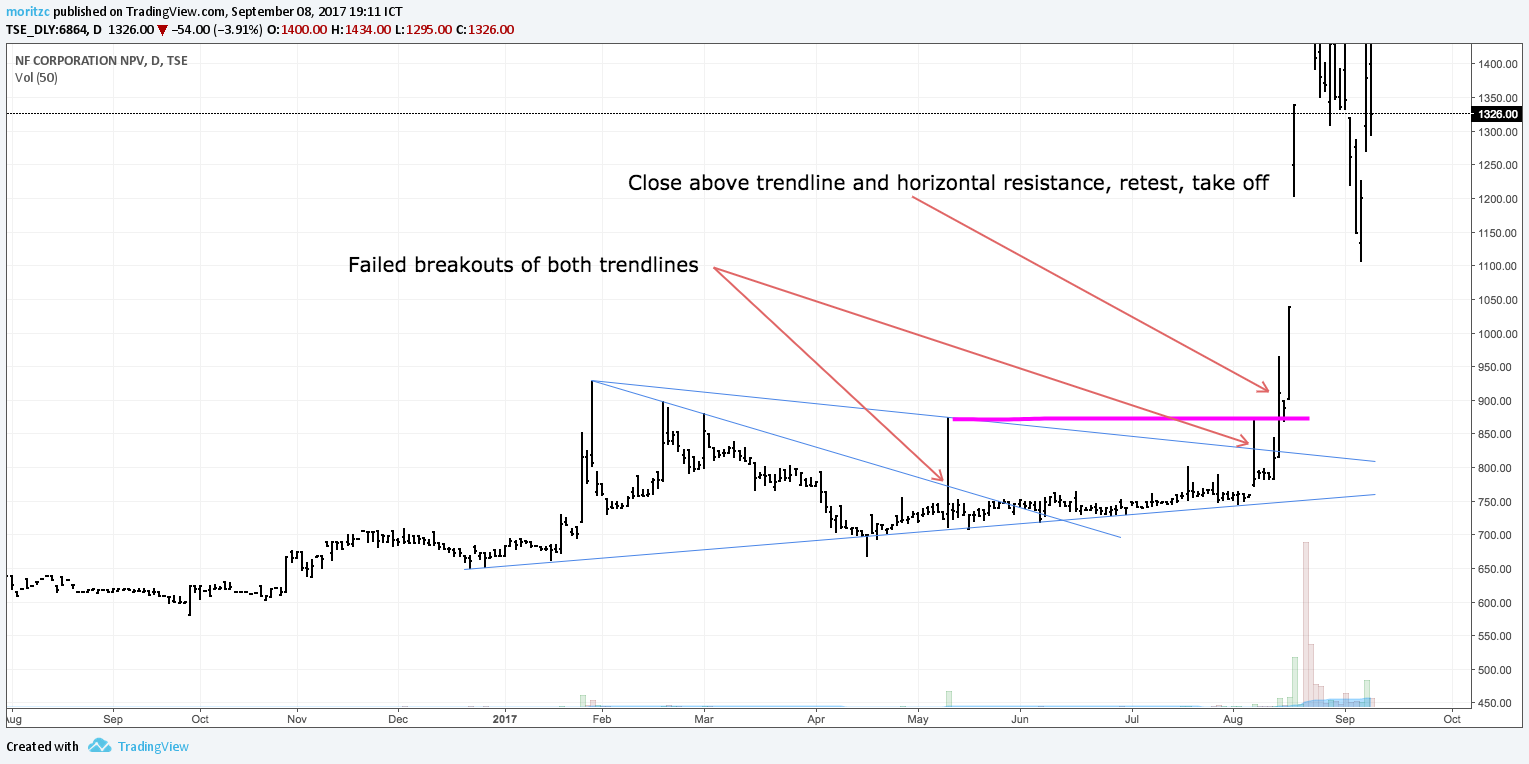
As you can see, our symmetrical triangle (blue lines) morphed into a rectangle after its breakout (pink lines), and we then got a Head & Shoulders with a horizontal neckline inside that rectangle (shown by the green lines) before we broke out of both the Head & Shoulders and the rectangle for a parabolic move.
Chart patterns with horizontal boundaries in most instances can and will not morph into new chart patterns when they break out due to their nature, which is a huge advantage. Also, our stops are much better protected in the case of horizontal boundaries, as the retest happens at the same level the price broke out of. In the case of diagonal boundaries when price retests, it will be at another price level, which is problematic, especially if we apply the last day rule.
Additionally, it is much easier to read whether a horizontal breakout fails or not – it goes back into the boundaries of the pattern, it failed. It doesn’t, we can comfortably manage our way along price action. With diagonal boundaries, management gets much harder.
How do we protect against this? By applying one simple trick: we wait until the last significant high/low (the last point our trendline / chart pattern boundary connected with) gets broken, as well. In our example above, that would simply be the breakout after the Head & Shoulder structure.
Here are more examples.
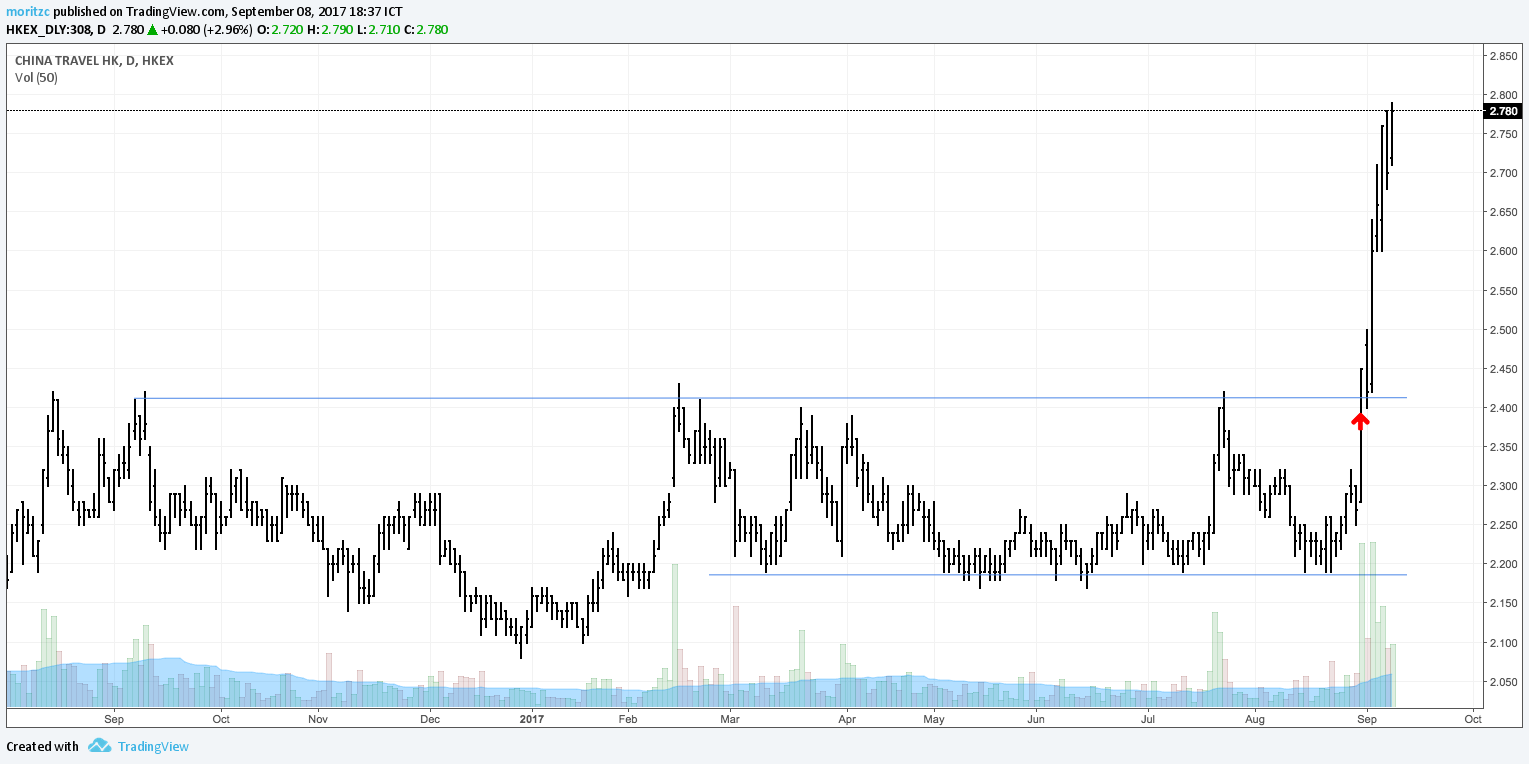
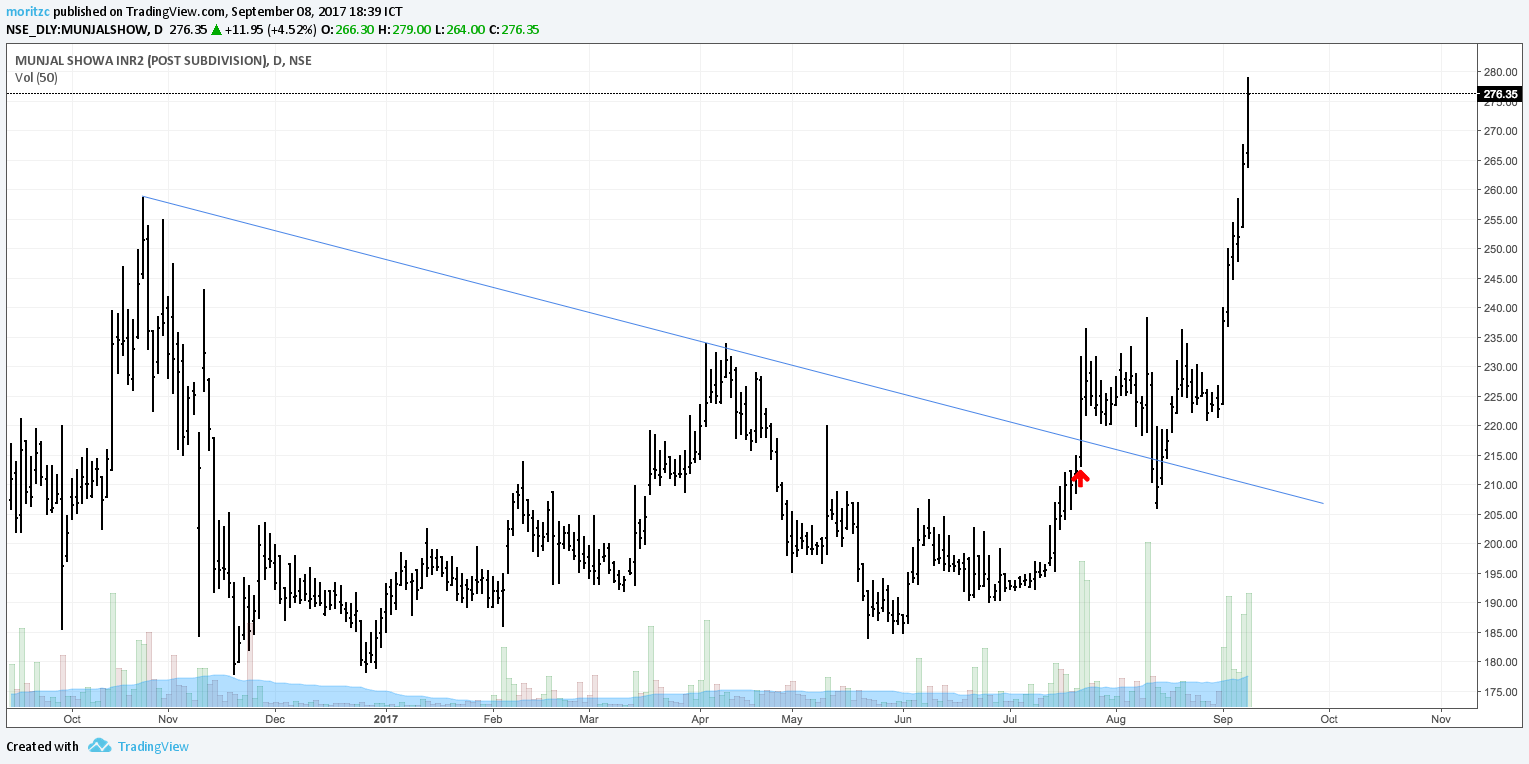
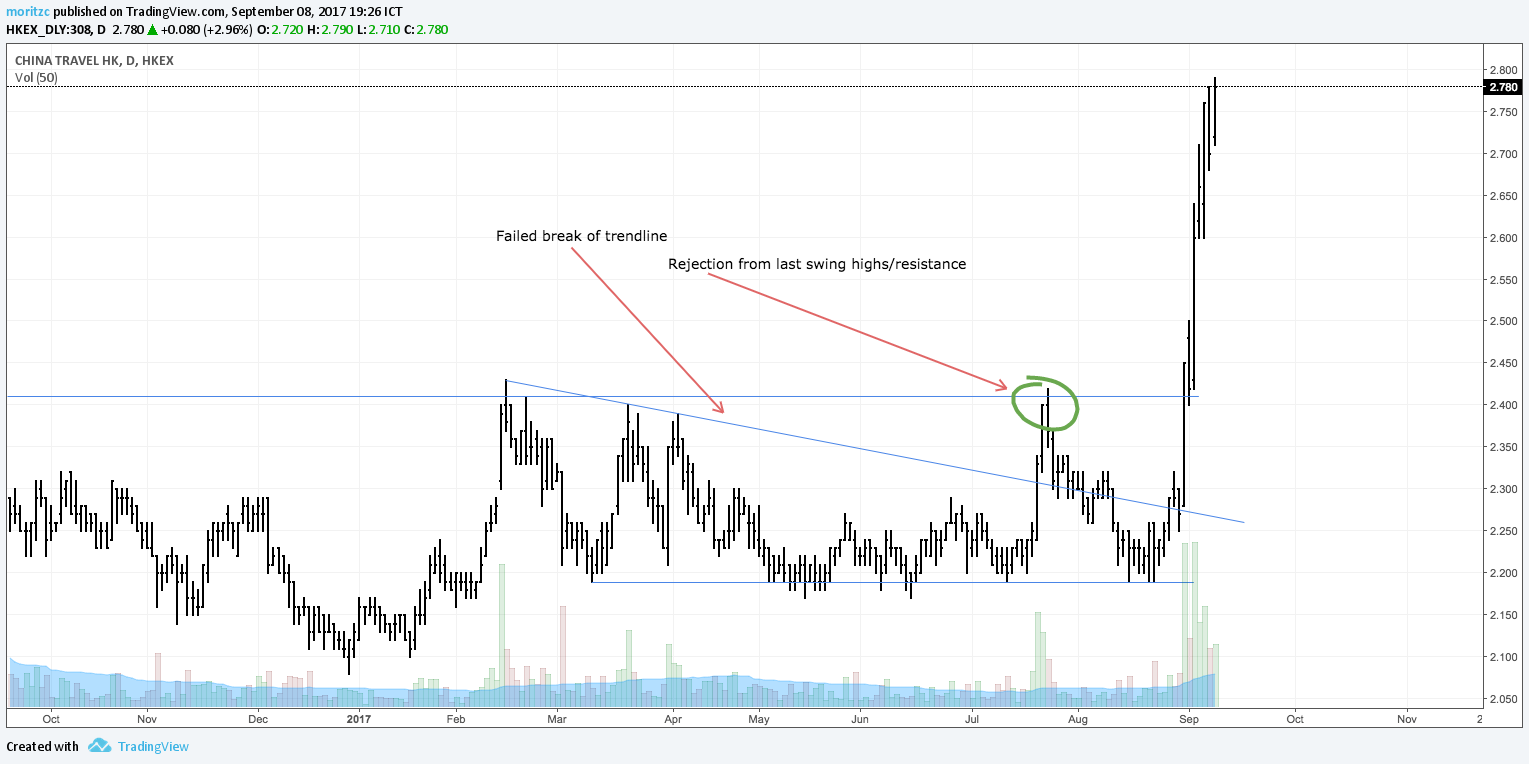
In the first example, the break of the trendline coincided with the break of the last swing high, which is absolutely fine – in conjunction with other factors, this can be a fine trade. In the 2nd and 3rd example, once more we have the break of the trendline and then the rejection from the last swing high/low.
In the 2nd example, once more we have the break of the trendline and then the rejection from the last swing high/low. Price then retests the trendline and breaks below the resistance created by the rejection, a great trade.
And finally, in the 3rd example, we have two failed trendline breaks, of which the second morphs our symmetrical triangle into a flat top triangle – we break it (close above is important!), retest this horizontal boundary and off we go.
So either we break the trendline and the last swing high/low in a bold move and can get in immediately, or we break the trendline, get rejected from the last swing high/low, thus create a new S/R there, retest our trendline, then break through the newly created S/R and have a HIGH-quality trade – one of my favorites, actually.
In every chart pattern with a horizontal boundary that I trade, I look for a trendline INSIDE that chart pattern that was already broken and retested into the direction of my trade in order to increase the probability for my horizontal breakout.
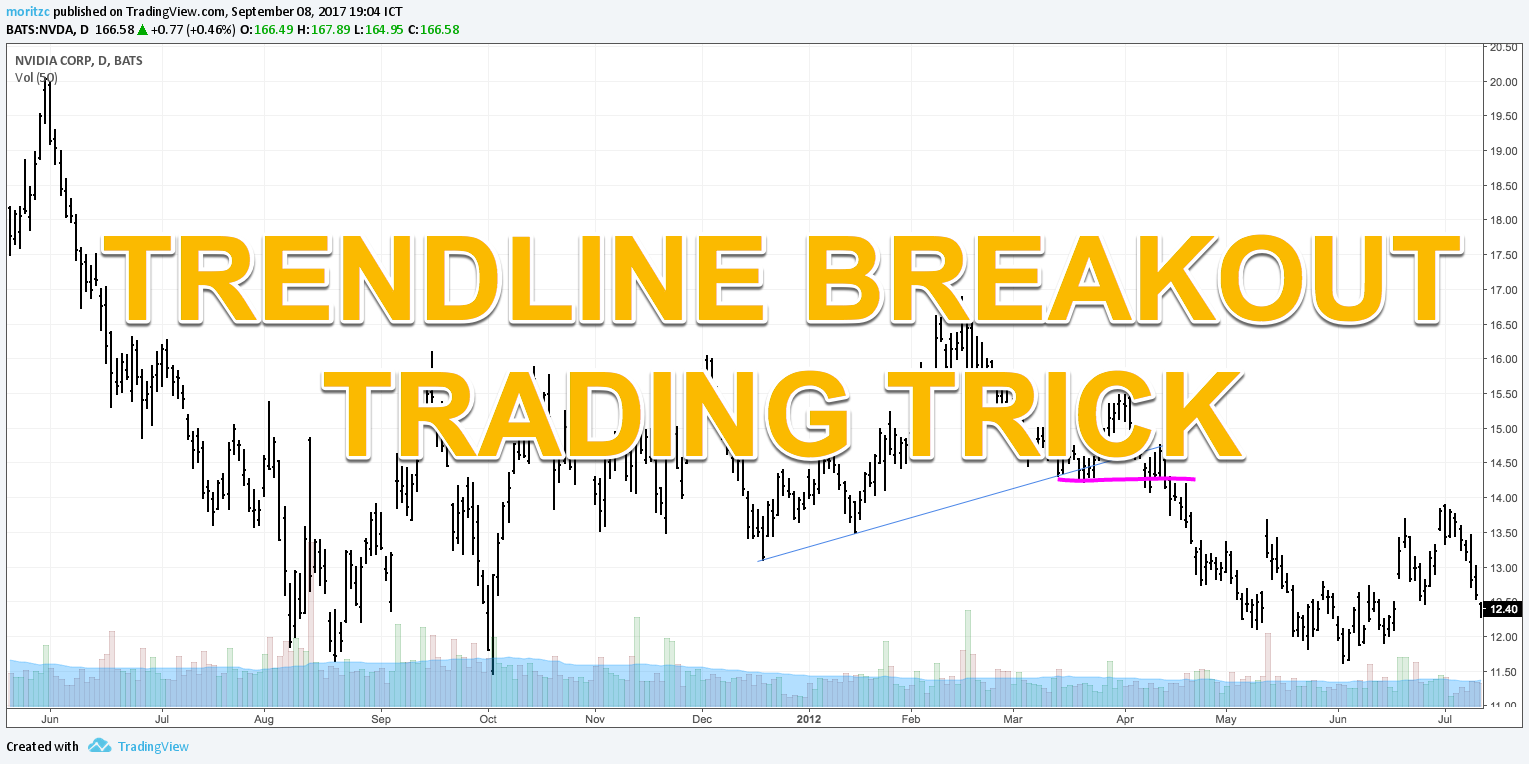
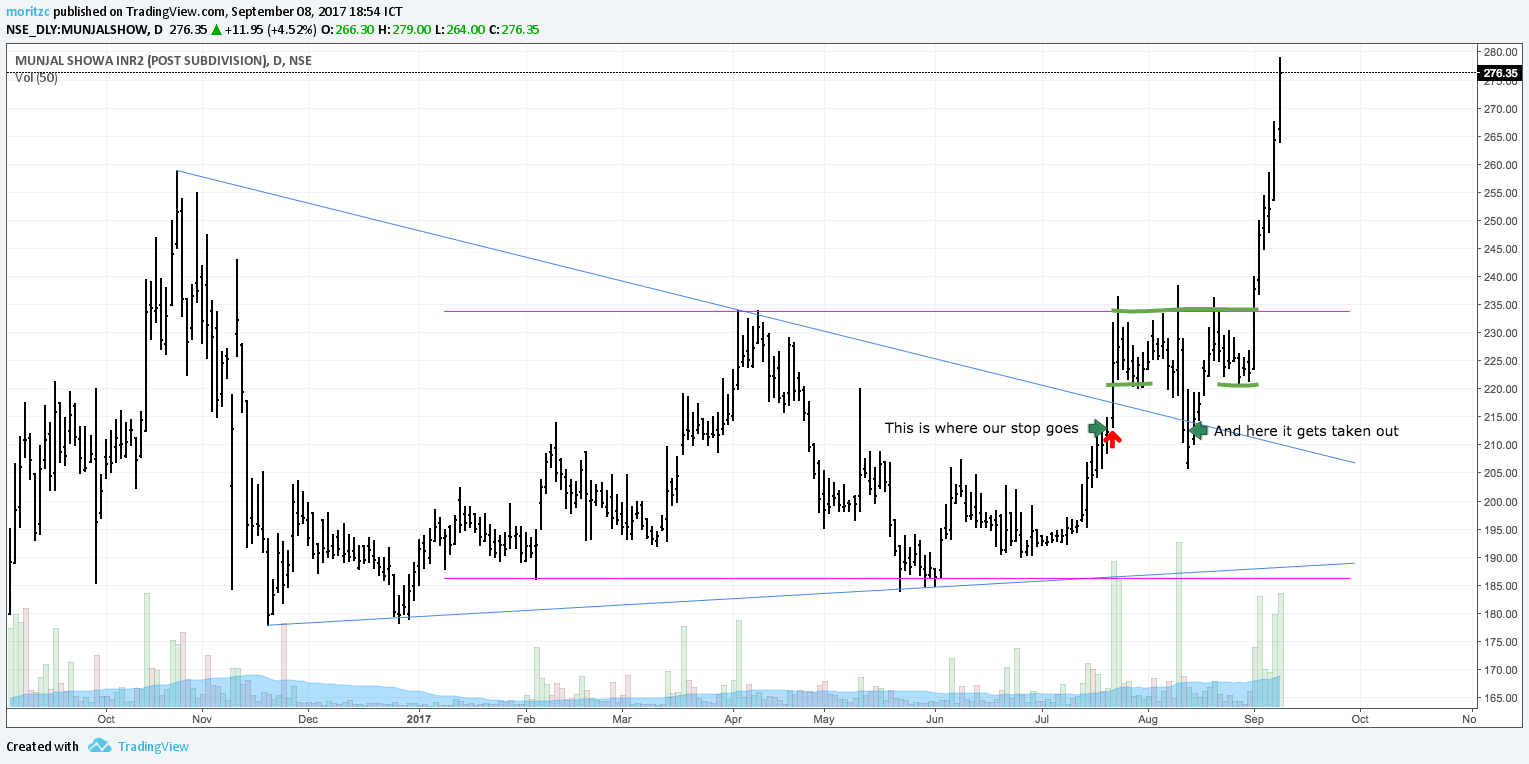
And this brings us back to our first example, see what happened there.
Looks familiar doesn’t it. Now, in this case, we already had a strong resistance established and it goes without saying that we shouldn’t trade into those or at least protect our profits when we run into them, but again, the first significant high/low that we hit after a trendline break more often than not acts as formidable S/R and we should wait until it breaks for easier stop placement and higher follow through rate.
Especially when we are trading chart patterns on their own without any regard to S/R and look only at the quality of the chart pattern itself, this knowledge can save your account. Also, going with the trend and having clearly defined, CLEAN pattern boundaries helps a lot when trading these.
As always, questions in the comments below!


external link:
external link:


3 min read
The following is a guest post from Michael Lamothe.
I'm Michael Lamothe, and today marks an extraordinary milestone: the first anniversary of "The...
3 min read
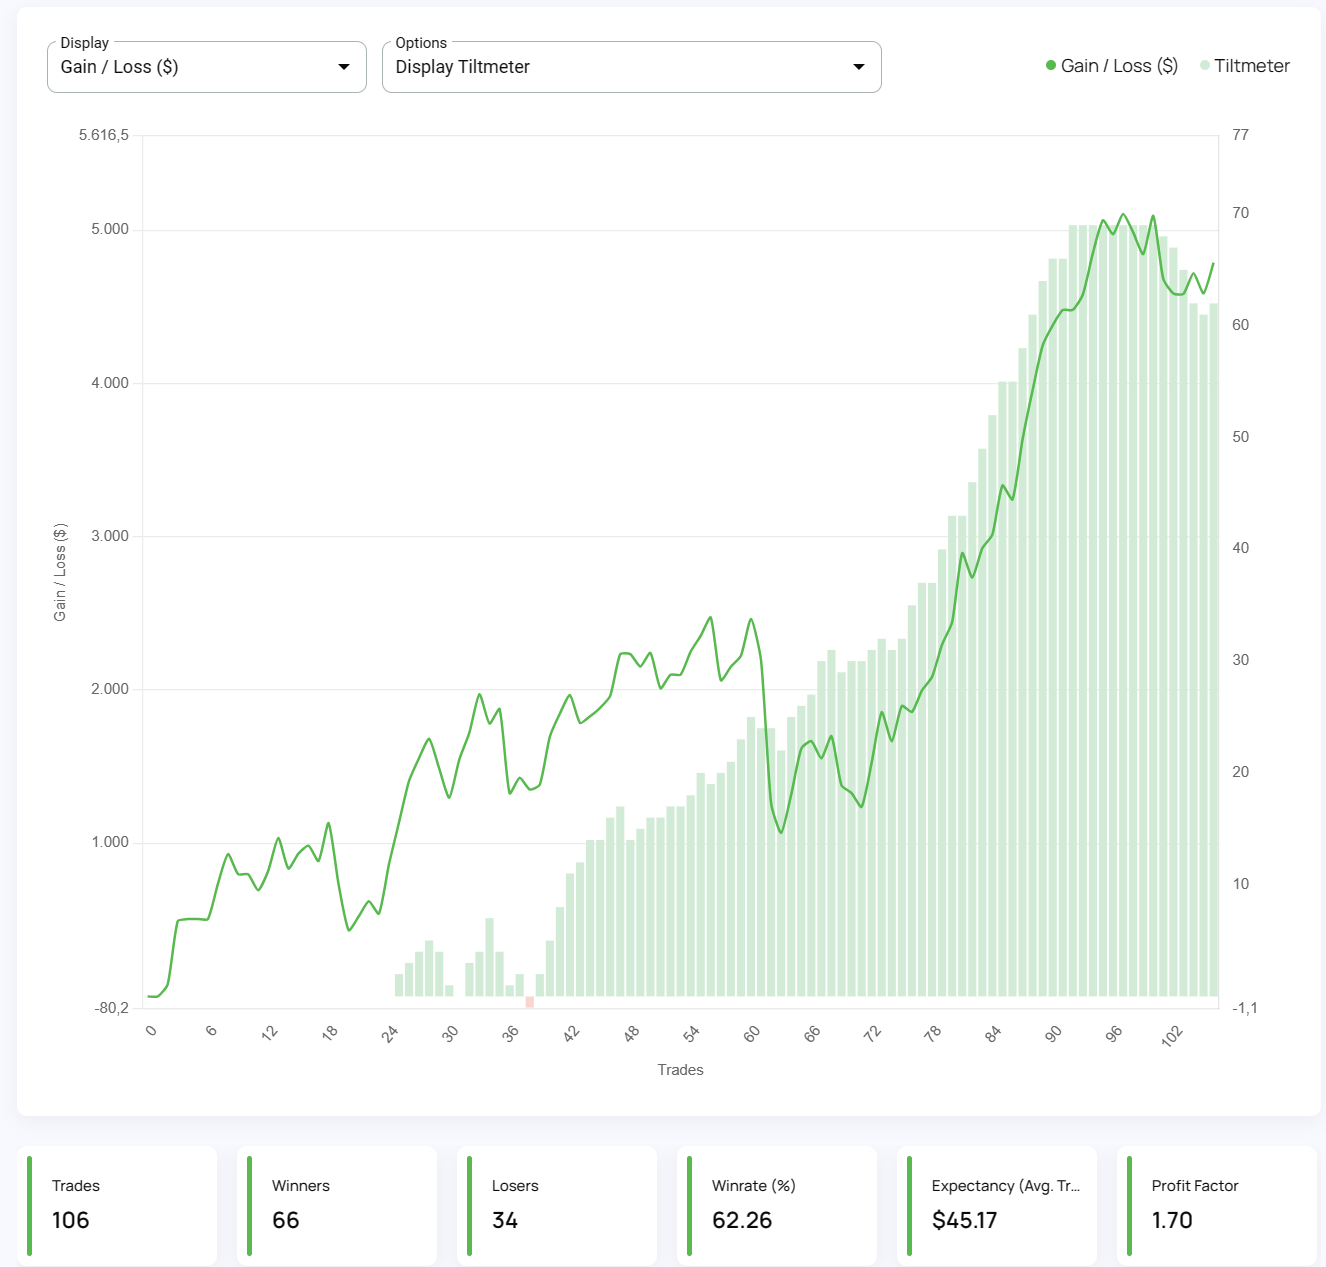
It's easy to get discouraged by losses and question your every move. But what if there was a way to track your progress, learn from mistakes, and...

8 min read
Dive deep into the world of finance and high-stakes trading with this selection of movies and documentaries! From the exhilarating thrill of...