Supply and Demand Trading in 2026
We have been trading supply and demand strategies for over ten years, and they have stood the test of time remarkably well. Supply and demand is...

In today’s world, math and statistics are not very popular and most people don’t even understand basic mathematical and statistical concepts. Whereas in most professions you can still find a way to work around your lack of knowledge, if you fail to understand or misunderstand math and statistics in trading, it is very hard to trade profitably.
In the following math guide for traders we will provide you with a crash course of the most important mathematical concepts and explain how they affect your trading. To give you a little overview, this article includes the following concepts:
Financial instruments move in Pips and an appreciation of 1 pip means that the instrument is rising 0.0001 ‘units’ or points (Yen pairs are an exception – 1 pip equals 0.01 points).
The EUR/USD exchange rate is currently 1.2520 and if the EUR/USD rises to 1.2530, it equals an appreciation of 10 pips. Some brokers quote their pips in the so called pipettes where 1 pip equals 10 pipettes.
The value of one pip is different for different currency pairs, but you can calculate it very easily:
Value Of One Pip = (0.0001 / Current Exchange Rate) * Trade Size
If you want to trade the EUR/USD with its current exchange rate of 1.2520 and a contract size of 1 standard Lot ($100.000), you can calculate the pip value as follows:
Value of one pip = (0.0001 / 1.2520) * $100.000 = 7.99 EUR
If you multiply it by the current EUR/USD exchange rate, you receive the USD value: 7.99 EUR * 1.2520 = $10
Lot |
Units |
Pip value* |
| Standard Lot | 100.000 | $10 |
| Mini Lot | 10.000 | $1 |
| Micro Lot | 1.000 | $0.1 |
Especially in forex, leverage plays an important role. The contract size in forex are Lots and 1 Lot equals 100.000 units, but since most forex traders don’t have a trading account that would allow them to buy or sell $100.000 when entering a trade, leverage is a trader’s best friend – or enemy in most cases.
Leverage in a nutshell means that your broker lends you money so that you can enter a position that is actually too big for your trading account. But without leverage, most traders wouldn’t even bother trading because their profit opportunities would be close to zero.
If you want to take a trade with the size of one standard Lot, you’d have to buy $100.000 to enter the position. But if you chose a leverage of 100:1, you can enter a one standard Lot position with an account of only $1.000:
Required Account Size = Trade Size In $ / Leverage
$100.000 / 100 = $1.000
Leverage and the risk of wiping out a trading account go hand in hand, and after Oanda analyzed the performance of their customers’ trading accounts, they found the following relationship: traders who use a leverage of 50:1 have a 15 times higher chance of blowing up their accounts than traders who only use a leverage of 10:1.

Margin is very similar compared to leverage and it’s mainly just another way of looking at the same thing. If your broker requires you to have a 2% margin, it just means they are offering you a 50:1 leverage ratio.
Leverage = 1 / Margin
50:1 = 1/2% = 1/0.02
This means that your trading account has to be at least 2% of the value of the trade you are about to take. Margin, therefore, works as a deposit that the trader hat to provide to the broker when entering a trade.
With $1.000 margin (a trading account of $1.000), you can trade up to $100.000 with a 100:1 leverage (1% margin requirement).
When a losing trade falls below the maintenance margin, you receive a margin call and your positions are being liquidated by your broker or you are required to deposit additional funds to remain in the trade.
Leverage |
Margin |
Notional Position Size (1 Lot) |
Margin Required (Trading Account) |
| 1:1 | 100% | $100.000 | $100.000 |
| 10:1 | 10% | $100.000 | $10.000 |
| 50:1 | 2% | $100.000 | $2.000 |
| 100:1 | 1% | $100.000 | $1.000 |
| 200:1 | 0.5% | $100.000 | $500 |
Position sizing is straight forward with 4 easy steps and you only need the following figures to determine the size of your position correctly:
Risk = [(Your Account Size) * (%-Risk Per Trade)]
$50.000 * 1.8% = $900
You are willing to risk $900 on this single trade
Stop Loss In % = 1 – (Stop Price/Current Price)
1 – (40/45) = 11%
Position Size = Your $-Risk / %-Stop Loss
$900 / 11% = $8.180
Number Of Shares = Position Size / Current Stock Price
$8.180 / $45 = 180
You have to buy 180 shares for the current price of $45 to enter the trade with the correct position size.
The expectancy of your trading system is the USD-value that each individual trade you take is worth and will yield you over the long term. You need the following figures to calculate the expectancy of your system and it’s the first and easiest way to see whether your system is profitable or not.
Expectancy = Winrate*(Account Size * %-Risk * Risk:Reward) – Loss Rate*(Account Size * %-Risk)
Expectancy = 60% * ($50.000 * 1% *2) – 40% *($50.000 * 1%) = $400
In general, the expectancy formula consists of 2 parts: the expected return of a winning trade and the average loss of a losing trade:
Expected Profit Of A Winning Trade = Winrate * (Account Size * %-Risk * Risk:Reward)
60% * ($50.000 * 1% * 2) = $600
Expected Loss Of A Losing Trade = Loss Rate* (Account Size * %-Risk)
40% * ($50.000 * 1%) = $200
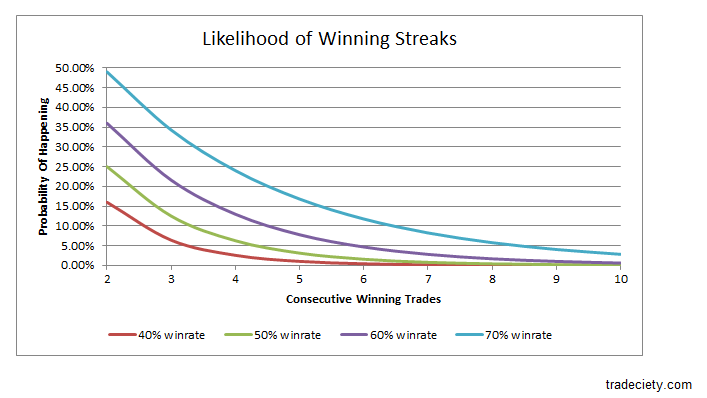
Traders underestimate the likelihood of losing and winning streaks, and in general lack the knowledge of how to calculate probabilities for losing and winning streaks. In the following we’ll show you how you can calculate the likelihood of streaks with a few simple formulas. You only need the statistics of your winrate [60%] and loss rate [40%].
2 Winners In A Row = Winrate * Winrate
60% * 60% = 0.6 * 0.6 = 0.36 = 36%
3 Winners In A Row = Winrate * Winrate * Winrate
60% * 60% * 60% = 21.6%
4 Winners In A Row = Winrate * Winrate * Winrate * Winrate
60% * 60% * 60% * 60% = 13%
The chart below shows you the probabilities of winning (or losing) streaks with certain lengths for different winrates.
Now that we know how to calculate the likelihood of winning and losing streaks and saw that it is far more likely to have 10 consecutive losing trades in a row than you thought, we can evaluate the effect of losing streaks on your account.
If you calculate your position size new after every trade, which is highly recommended, risking 2% per trade, 2 consecutive losing trades will not amount to 4%, but only to a loss of 3.96% – with each losing trade, the 2% risk per trade becomes a smaller $-amount.
Account Size |
$-Value Of 2% Risk |
%-Loss Of The Starting Account |
| $ 10.000 | $ 200 | |
| $ 9.800 | $ 196 | 2.00% |
| $ 9.604 | $ 192 | 3.96% |
| $ 9.412 | $ 188 | 5.88% |
| $ 9.224 | $ 184 | 7.76% |
| $ 9.039 | $ 181 | 9.60% |
| $ 8.858 | $ 177 | 11.41% |
The %-amount of consecutive losing and winning trades can be calculated as follows:
The %-Loss Of 2 Consecutive Losing Trades, Risking 2%:
1-[(1-0.02)*(1-0.02)] = 0.0396 = 3.96%
The %-Loss Of 3 Consecutive Losing Trades, Risking 2%:
1-[(1-0.02)*(1-0.02)*(1-0.02) ]= 5.88%
How big losses can get if you risk 1%, 2%, 4%, 5% or 7% per single trade you can see in the following table.
%-Risk Per Single Trade |
|||||||
| 1% | 2% | 4% | 5% | 6% | 7% | ||
Consecutive Losing Trades |
2 | 1.99% | 3.96% | 7.84% | 9.75% | 11.64% | 13.51% |
| 3 | 2.97% | 5.88% | 11.53% | 14.26% | 16.94% | 19.56% | |
| 4 | 3.94% | 7.76% | 15.07% | 18.55% | 21.93% | 25.19% | |
| 5 | 4.90% | 9.61% | 18.46% | 22.62% | 26.61% | 30.43% | |
| 6 | 5.85% | 11.42% | 21.72% | 26.49% | 31.01% | 35.30% | |
| 7 | 6.79% | 13.19% | 24.86% | 30.17% | 35.15% | 39.83% | |
| 8 | 7.73% | 14.92% | 27.86% | 33.66% | 39.04% | 44.04% | |
| 9 | 8.65% | 16.63% | 30.75% | 36.98% | 42.70% | 47.96% | |
| 10 | 9.56% | 18.29% | 33.52% | 40.13% | 46.14% | 51.60% | |
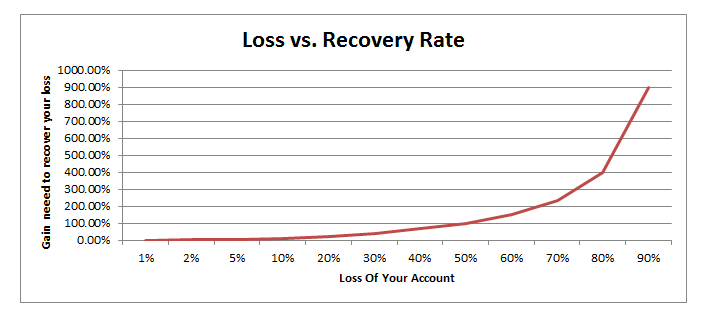
The problem with big losses is not only that they cost you a lot of money, but the time needed to recover from such losses. If you have a $10.000 account and lose 50% ($5.000) of your account, you need to regain 100% ($5.000) to get back to your original $10.000 most traders don’t make this connection and therefore significantly underestimate the meaning of losses. The following graph shows you the relationship in more detail. If you lose 70% of your trading account, you need to regain 233% to get back to where you started.
If you connect the three things we’ve discovered so far:
it becomes clear why a sound risk and money management approach should be the #1 priority for every trader.
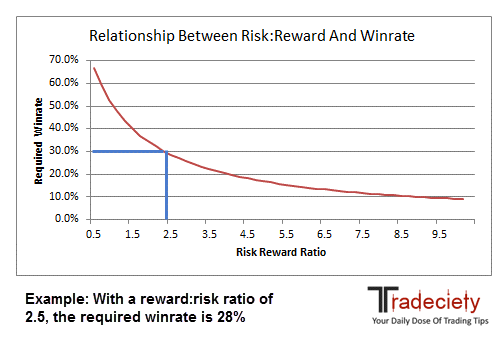
Did you know that you that your stop loss distance and your take profit distance, together with your past winrate can tell you if you should take a trade or if the specific trade would be unprofitable over the long term? Here is how you can combine winrate [60%], stop loss distance [40 pips] and take profit distance [65 pips] to check your trade for profitability:
Risk:Reward Ratio = Take Profit Distance / Stop Loss Distance
65 / 40 = 1.625
Required Winrate = 1/ (1+ Risk:Reward Ratio)
1 /(1+ 1.625) = 0.38 = 38%
The required winrate is smaller than the historical winrate (38% < 60%) which means that you can safely take the trade
Correlation is a statistical figure that shows you to which degree two financial instruments move together. The correlation is a number between -1 and +1; sometimes correlation is being displayed as percentage figures between -100% and +100% to allow a faster interpretation of the metric.
 Correlation -1:
If Stock A rises 1%, stock B falls 1%.
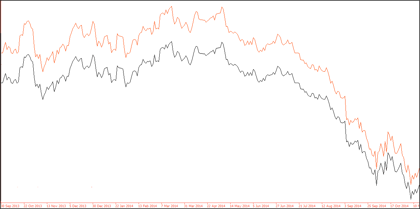
A correlation of -1 means that the two instruments are perfectly negatively correlated. If one asset rises, the other one falls at the same rate. The graph shows two instruments with a correlation of -1 – one graph is the mirror image of the other one.
Correlation -0.5: If Stock A rises 1%, Stock B falls 0.5%.
Correlation 0: No correlation between two instruments exists and they move completely independently from each other.
Correlation +0.5: If Stock A rises 0.5%, Stock B rises +0.5%.
 Correlation +1: If Stock A rises 1%, Stock B rises 1%.
A correlation of +1 means that two instruments move together identically with the same strength and also in the same direction.
The chart shows two stock prices with a correlation of +1 (+100%). Both instruments rise and fall together with the same strength. Although a correlation of +1 is very rare, you will often have correlations that are close to +1, signaling two very similar instruments.
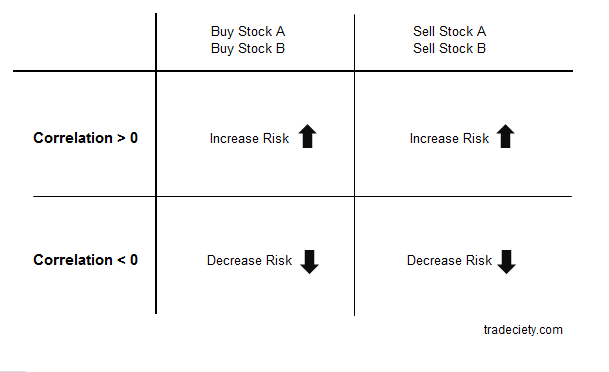
Correlations can increase or decrease your risk when entering trades. If you buy or sell two stocks that are positively correlated, you increase your risk because both stocks rise and fall together.
A negative correlation can decrease your risk since both stocks (and instruments) will move in opposite ways. When one stock rises, the other one will fall and therefore serve as some kind of hedge.
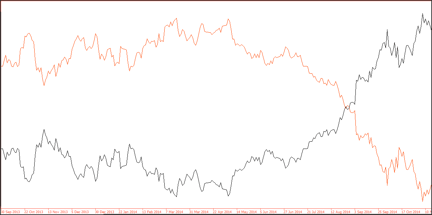
Correlations change over time and can even change from a positive to a negative correlation. The chart below shows the price development of the S&P500 and Oil. As you can see, both instruments have been correlated positively, but changed to a highly negative correlation in recent times and also had times when no correlation existed.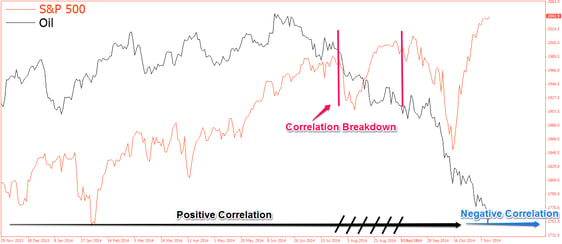
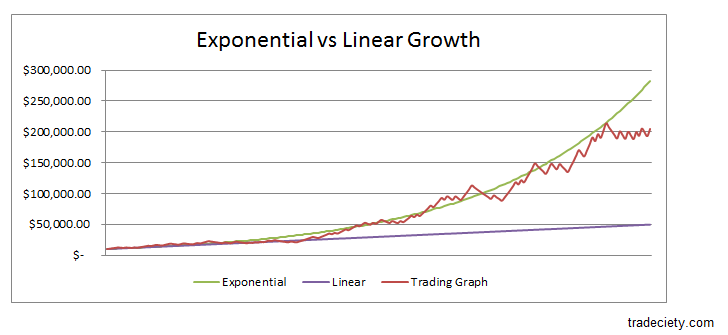
The ‘magic’ why your trading account can grow fast is because of exponential growth. When you have a regular 9-5 job you get a constant salary and the income in one month is usually independent from the one you got the month before. In trading, your capital can work for you and if you have a winning trade, you can risk a higher $-amount on your next trade and therefore also make a greater profit. The graph below compares linear growth (blue) where you just save the same amount every single time, exponential growth (red) where you reinvest your profits and the red graph that simulates the trading performance (risk:reward 2:1 and winrate 50%). While the linear graph has only risen to $50.000, the exponential graph grew to $280.000 and the trading graph to $200.000. All three graphs are based on an initial investment of $10.000 and a 2% growth rate.
Randomness, Independence and Sample-Size-Thinking are three of the main statistical concepts that traders get totally wrong and are the main reasons why they completely misinterpret their trading performance.
Randomness means that the distribution between winning and losing trades is completely random over the short-term.
The concept of independency means that one trade is completely independent from the one before. If your last trade was a winner, it does not have any impact on the outcome of your next trade.
Both, the concept of randomness and independence are being misunderstood by traders because they don’t understand the most important concept: statistically significant sample-sizes. The mistake traders often make is that they judge their trading system based on the outcome of just a handful of trades.
We’ve seen above that it’s more likely to have 2 winners in a row than 3, but statistics only provide meaningful information if you analyze a big enough sample size. Therefore, don’t make premature decisions whether your trading system is ‘good’ or ‘bad’ after 10 or 20 trades, but take 100 trades with the exact same rules and then analyze your performance.
Whereas not understanding or being aware of how math and statistics work in trading will significantly deteriorate your overall edge, you don’t need to get your Master’s degree to trade profitably. In most cases, it’s even sufficient if a trader would apply some common sense when trading. With the concepts in this math guide for traders you are good to go and it includes all mathematical and statistical principles you will ever need in your trading.
external link:


We have been trading supply and demand strategies for over ten years, and they have stood the test of time remarkably well. Supply and demand is...

3 min read
Choosing the right trading journal is essential for traders wanting to analyze performance, refine strategies, and improve consistency. In this...

3 min read
“95% of all traders fail” is the most commonly used trading related statistic around the internet. But no research paper exists that proves this...