3 min read
A Year with "The Trading Mindwheel": Transforming Trading Through Psychology
The following is a guest post from Michael Lamothe.
I'm Michael Lamothe, and today marks an extraordinary milestone: the first anniversary of "The...
There are numerous profitable candlestick signals in the field of technical analysis. Not all of them perform well. In every case, the likelihood of success is situational, contingent on several other factors–technical and fundamental–that present themselves in the market. Although you should always keep your eye on the big picture–taking into account every relevant factor that can shape your market or instrument of choice–it helps to know which candlesticks have a historically-demonstrated pattern of consistency and success.
There are roughly ten that have statistically significant levels of accuracy–from 84% to 57%. We also give credit to the research that Thomas Bulkowski has done in this field and from whom we derive much of what we’re about to present.
So let’s get to it–the 10 top-performing profitable candlestick signals.
Heads up
First, because this is derived from historical performance, some of the statistics might change over the course of years. So, be sure to check the stats every now and then to get an updated picture of their overall statistical performances.
Second, these patterns work best across longer time frames, like daily and weekly time frames. Anything less than an hourly time frame is too vulnerable to market noise to be considered significant.
Finally, trading candlesticks without any other confluence is not recommended. Although there are well-performing candlestick patterns, we recommend adding other confluence factors to create a robust price action trading system.
What’s happening here is clear. You have three trading sessions that are trending downward. The bears are in control. Suddenly, bearish sentiment gets disrupted by a powerful move. You have an up session whose body, in a single candle (or session, depending on your time frame) engulfs the previous three candles (or session). Not only is that a major statement among buyers, but it also appears that a potential trend reversal is emerging.
Theory conflicts with historical performance here. This is supposed to be a bearish “continuation” pattern, but more often than not, it marks a bullish trend reversal. This is where you might check the news, fundamental outlook, major reports, etc to see what exactly is causing the sharp reversal. Might it be profit-taking among major shorts, a short squeeze, or a bullish change in supply and demand. Check the big picture before treating it as a continuation or a reversal.
Pattern type: Continuation (bearish)
Historical Accuracy: 84% bullish reversal.
Frequency: Rare
The reason why this often acts as a bullish reversal contrary to theory is that it doesn’t take much for the sellers to cover their positions and more buyers to jump in once there’s a close beyond the high of the reversal candle. It becomes clear that the downtrend is under threat, and so the surrounding technical and fundamental context has to be considered before deciding on a directional bias.
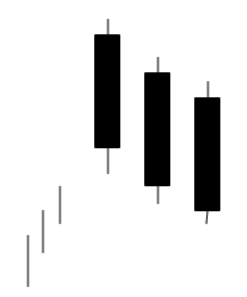
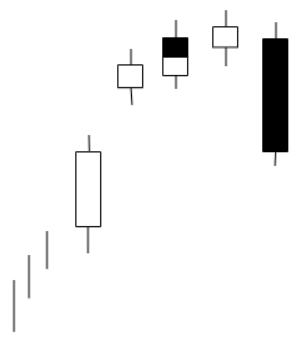
Imagine an uptrending market whose direction suddenly gets disrupted by three large sessions in a row. Each candle closes below the previous sessions’ lows. If the candles close in or below other critical trend components, such as the last swing low, a strong level of support, or a standard trend measure, such as the 50-day moving average, then the uptrend is clearly in question. And if it does this with relatively high volume or with strong fundamental rationale, then you might have even more reason to believe that a bearish reversal may be taking place.
Pattern type: Bearish reversal
Historical Accuracy: 78%
Frequency: Moderate
The Three Black Crows pattern happens frequently enough for traders to take advantage of it on a regular basis. There are many ways to trade this pattern. And some methods may even preempt the pattern before it forms. But since this exceeds the scope of this post, we’ll leave that up to you. The important thing to note here is that 78% of the time, the outcome tends to be a bearish reversal. Three solid down sessions can be a strong signal from the market. So unless you have a reason to take a contrarian position, it’s best not to fight it.
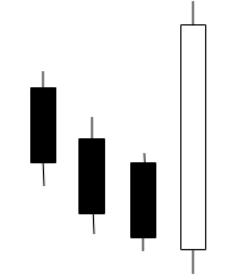
The bullish abandoned baby is a reliable and high-probability reversal scenario with a 70% accuracy rate. However, there’s one big problem: it’s so rare that you will almost never find it. But the good news is that should you ever come across this rarest of pattern species, you’ll want to seize the opportunity (carefully, of course).
Pattern type: Bullish reversal
Historical Accuracy: 70%
Frequency: Rare
This three-candle pattern is characterized by three events: a bearish session, a gap down resulting in a small indecisive doji pattern, and a strong gap upward. The top of this chart pattern makes for a good long entry upon a breakout on high volume. A stop-loss at the bottom of the pattern would also be a smart exit should the pattern itself break down.
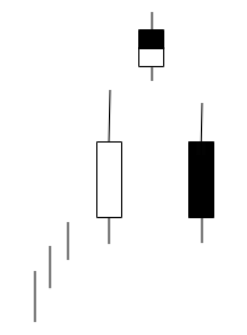
The price of an asset is skyrocketing. It opens up with a gap up and stands alone, appearing like a star in the night sky. But then, it plunges in the next session, as if vulnerable to the gravity of bearish sentiment. What will happen once it opens the next trading session? This is the evening star.
The evening star formation, which consists of three candles, is almost like the evening doji, but it has a body in the middle star. The body can be bullish or bearish. What’s critical is the direction of the last candle. And once that last candle breaks toward the downside, you might not want to be holding a long position.
Pattern type: Bearish reversal
Historical Accuracy: 72%
Frequency: Moderate to rare
Evening stars don’t happen frequently, but they tend to stick out once you see the formation. If it occurs in an upswing, it tends to mark a reversal 72% of the time. Watch for the breakout at the bottom of the pattern. That usually confirms the reversal. Following the breakout, look for high volume and other trend indicators such as support, or swing low levels.
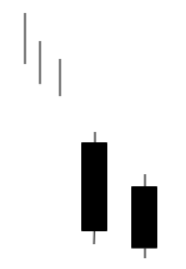
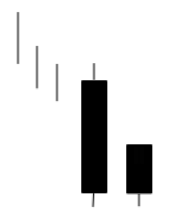
Let’s suppose you’re short a given market. The next day, it gaps down–a good sign. The day after that, it attempts to rally but the high is still lower than the previous day’s high, and it ends the day lower. At this point, you know that the market is going to continue to tumble. This is called “Two Black Gapping,” and it’s a powerful bearish signal.
Pattern type: Bearish continuation
Historical Accuracy: 68%
Frequency: High
There are two things that make this candlestick pattern highly favorable and effective. First, it has a 68% accuracy rate; but second, and perhaps most importantly, it occurs very frequently in the markets, making it a highly tradable pattern. Just one caveat: this pattern works best when the main trend is downward, so be careful when using this trend in a correction of an uptrending market.
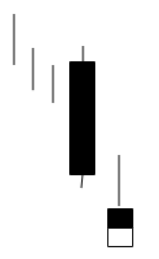
A market is trending downward. You have a solid black candle representing a bearish session. On the following day, price moves lower, but then it shoots up only to reverse downward again. These two candles (emphasize: not one candle but two) comprise the “inverted hammer” formation.
Pattern type: Bullish reversal
Historical Accuracy: 57% bearish continuation
Frequency: Moderate
If you look at the bullet points above, you’ll notice that this pattern shares something similar to the three-line strikes pattern: it does the exact reverse in actuality what it’s supposed to do in theory.
Remember, that this is a two-candle pattern and that the hammer itself can be bullish or bearish. It’s supposed to indicate a disruption of the downtrend but more than half the time, price tends to continue downward.
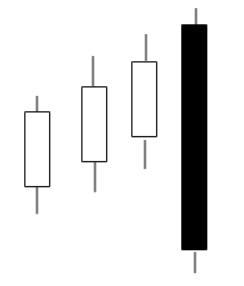
This is very similar to its bearish counterpart but its historical stats differ. The theory has it that this pattern is a bullish continuation. But in most historical performance, and bear in mind that three line strike patterns are very rare which is probably why its results show more statistical significance (not enough sample size data), this pattern tends to signal a trend reversal.
Pattern type: Continuation (bullish)
Historical Accuracy: 65% bearish reversal.
Frequency: Rare
Similar to its bearish counterpart, it doesn’t take much for this pattern to change the trend. A close below this pattern, especially if it breaks below critical support, can signal an extended correction or even a trend reversal.
This is a rare and tricky candlestick pattern to find, but its accuracy, if you can find it, is relatively promising at 63%. Why is it tricky? Because it consists of five candles.
If you can identify this pattern, the stats are favorable.
Pattern type: Bearish reversal
Historical Accuracy: 63%
Frequency: Extremely rare
Note that this is perhaps one of the rarest patterns to find, but if you do find it, the outcome is fairly reliable. Also, the psychology behind the pattern makes sense–a weakening rally and a strong bearish response typically signals the likelihood of further decline.
Let’s suppose the market is pulling back from an upswing. A bearish candle closes near its lows. The next candle opens higher but closes near its lows. Two bearish candles side by side. The critical piece of this formation is that both tested the exact same lows but neither candle violated support.
In theory, this is a setup for a bullish reversal or the continuation of the uptrend. Except that in most situations, it does the exact opposite.
Pattern type: Bullish reversal
Historical Accuracy: 61% bearish continuation
Frequency: Moderate
This is another formation that tends to perform well but contrary to its theoretical expectations. All it takes is for the bottom to give way. But confirmation of further downside depends on other technical criteria, the easiest of which is a break below a previous swing low or critical support. And if the selling volume is high, then the probability of further declines tends to be higher.
Now, if the following candle closes higher while remaining above the previous swing low, and if the downswing was corrective (preferably remaining above the 61.8% fibonacci retracement level), then chances are that the uptrend will continue (and hence, fulfilling its theoretical expectation as a bullish reversal).

You have a long position and you notice a gap opening toward the upside one day. The shadows of either candle doesn’t enter the gap that’s been created. The following day, a bearish candle opens within the body of the previous candle, but it doesn’t close the gap. Does the selling signal a bearish reversal, or does its inability to close the gap signal more bullish sentiment?
Pattern type: Bullish continuation
Historical Accuracy: 57%
Frequency: Rare
If you’re sharp enough to catch this rare bird, it signals a potentially bullish sign. The problem is, its accuracy of 57% doesn’t make it all that reliable. But while some traders take the last candle as a possible bearish reversal, knowing that the bull trend continues more than half of the time may give you enough foresight to anticipate a bullish continuation. Just be prepared in case the outcome is a bearish reversal.
These are the ten top-performing candlestick patterns based on current research. What’s important for you as a trader is that you try to analyze the sentiment behind each candle formation. Ask yourself, “What is going on in each trading session (candle) that makes this formation reliable according to, or against, its theoretical expectations?”.
Candlestick patterns tell a story about the market in a given session. If you can learn how to interpret these individual “stories,” and if you’re able to understand the larger fundamental backdrop behind the overall narrative, then you may be able to take your trading to the next level.


external link:
external link:

3 min read
The following is a guest post from Michael Lamothe.
I'm Michael Lamothe, and today marks an extraordinary milestone: the first anniversary of "The...
3 min read
It's easy to get discouraged by losses and question your every move. But what if there was a way to track your progress, learn from mistakes, and...

8 min read
Dive deep into the world of finance and high-stakes trading with this selection of movies and documentaries! From the exhilarating thrill of...