3 min read
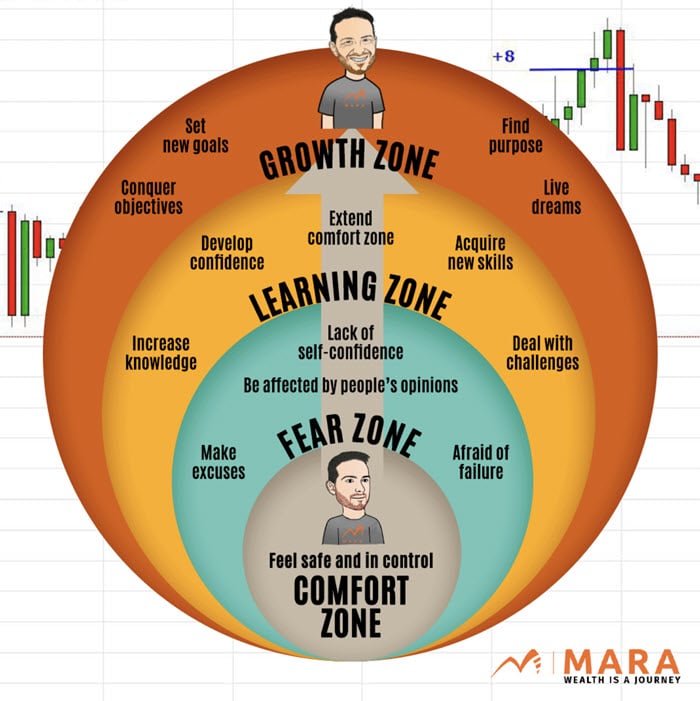
A Year with "The Trading Mindwheel": Transforming Trading Through Psychology
The following is a guest post from Michael Lamothe.
I'm Michael Lamothe, and today marks an extraordinary milestone: the first anniversary of "The...
Breakout trades are my favorite way of trading and since new trends usually start with a breakout, it really pays off to learn how to trade breakout strategies.
We also have a unique opportunity for all Tradeciety readers and we are giving our premium trading courses away for free! We just established a broker-sponsored cashback deal and you can learn our exact breakout trading strategies, and much more, for free! This is a first and no other trading website is doing anything similar. We are happy to finally give back to the trading community.
Although I do love pattern trading, you always need to ask yourself what the price action within the pattern is telling you. Most traders fall into the trap of template-thinking where they do not think about what the charts are telling them, but just hunt their memorized textbook patterns. But once you really understand what the chart structure tells you, you will suddenly be able to understand any price movement.
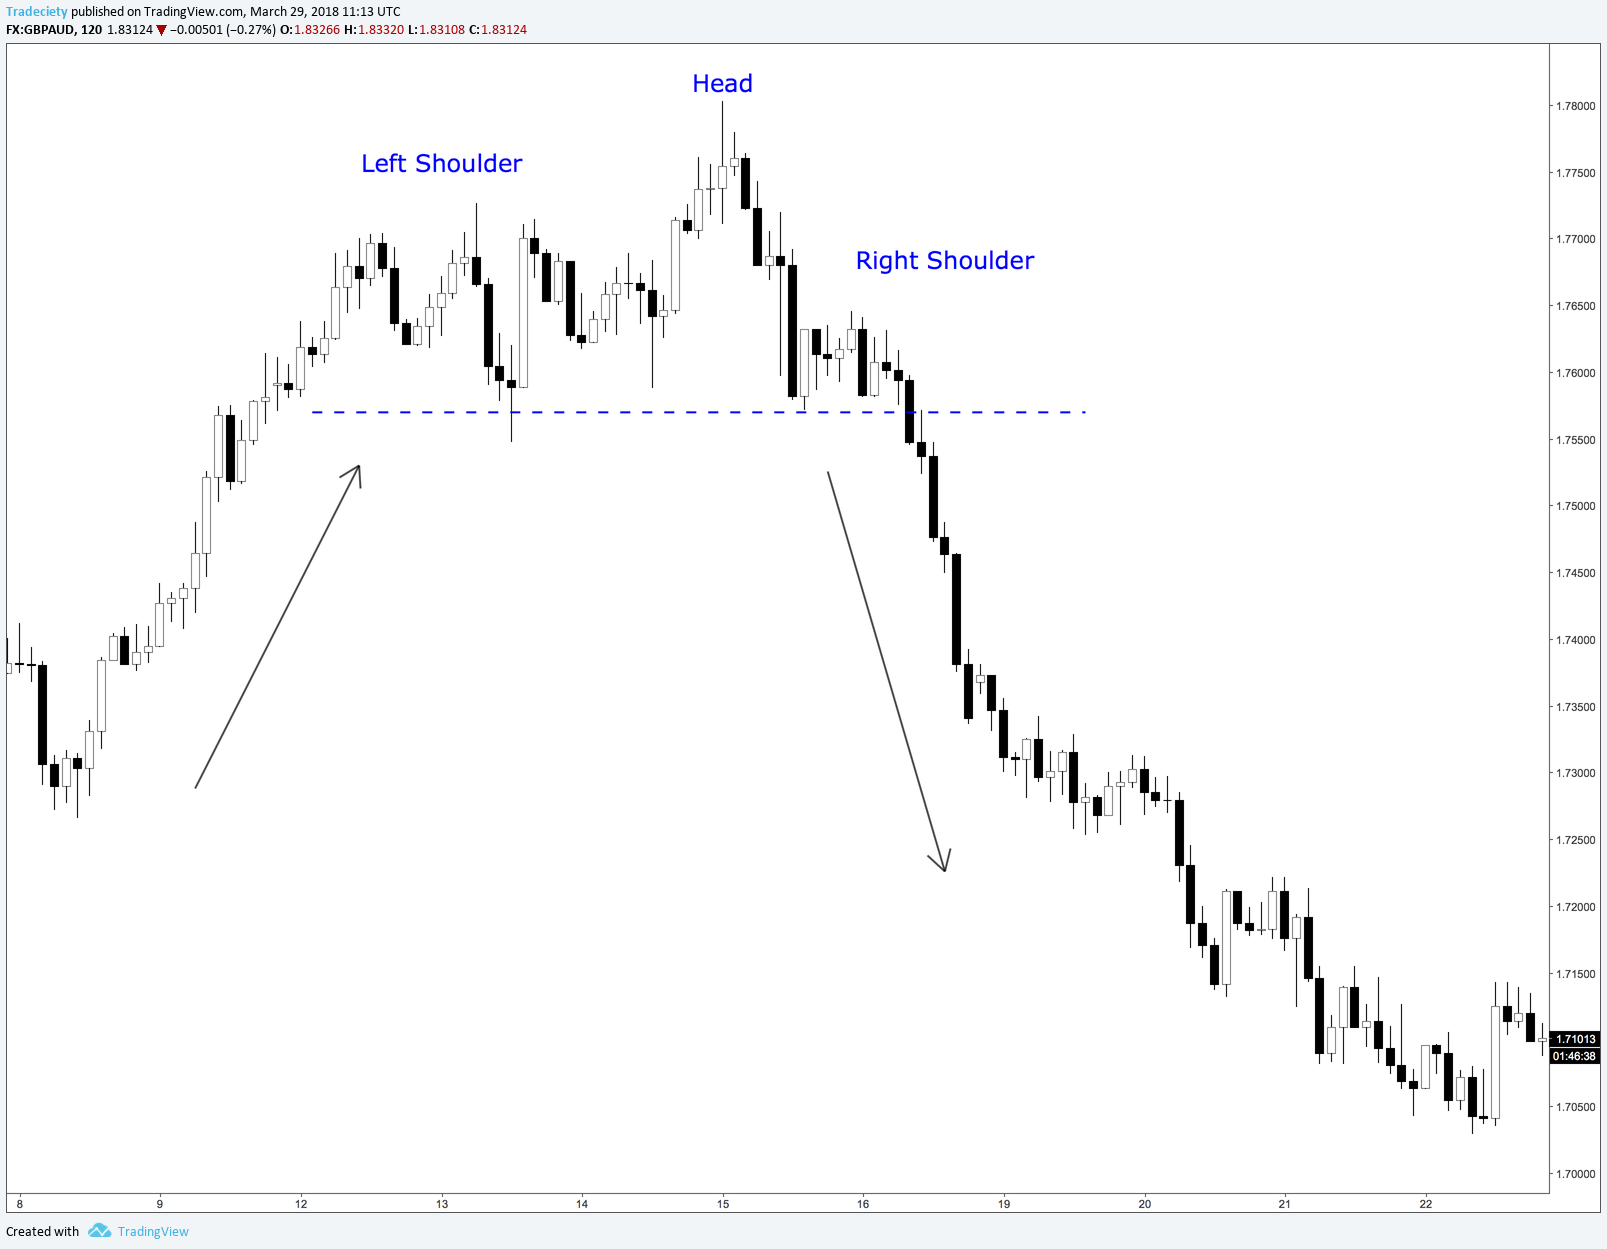
Many amateur traders believe that the Head and Shoulders pattern “doesn’t work” but I know professional traders who just trade this pattern exclusively. There are many variations of the Head and Shoulders pattern which most amateurs do not even recognize and then miss the effectiveness of this great pattern.
The Head and Shoulders pattern beautifully describes market momentum and the slowly turning buyer-seller strength. The scenario below shows illustrates that the market was in an uptrend but the buyers were not able to push the price much higher from the left shoulder to the head. The very low right shoulder further confirms that the buyers are withdrawing because the sellers did not allow the price to move much higher. The breakout then signals the shift towards a downtrend.
The next scenario has an even weaker head and, therefore, signals a market where the buyers have also lost the majority. The breakout happens very violently a the downtrend quickly accelerates.
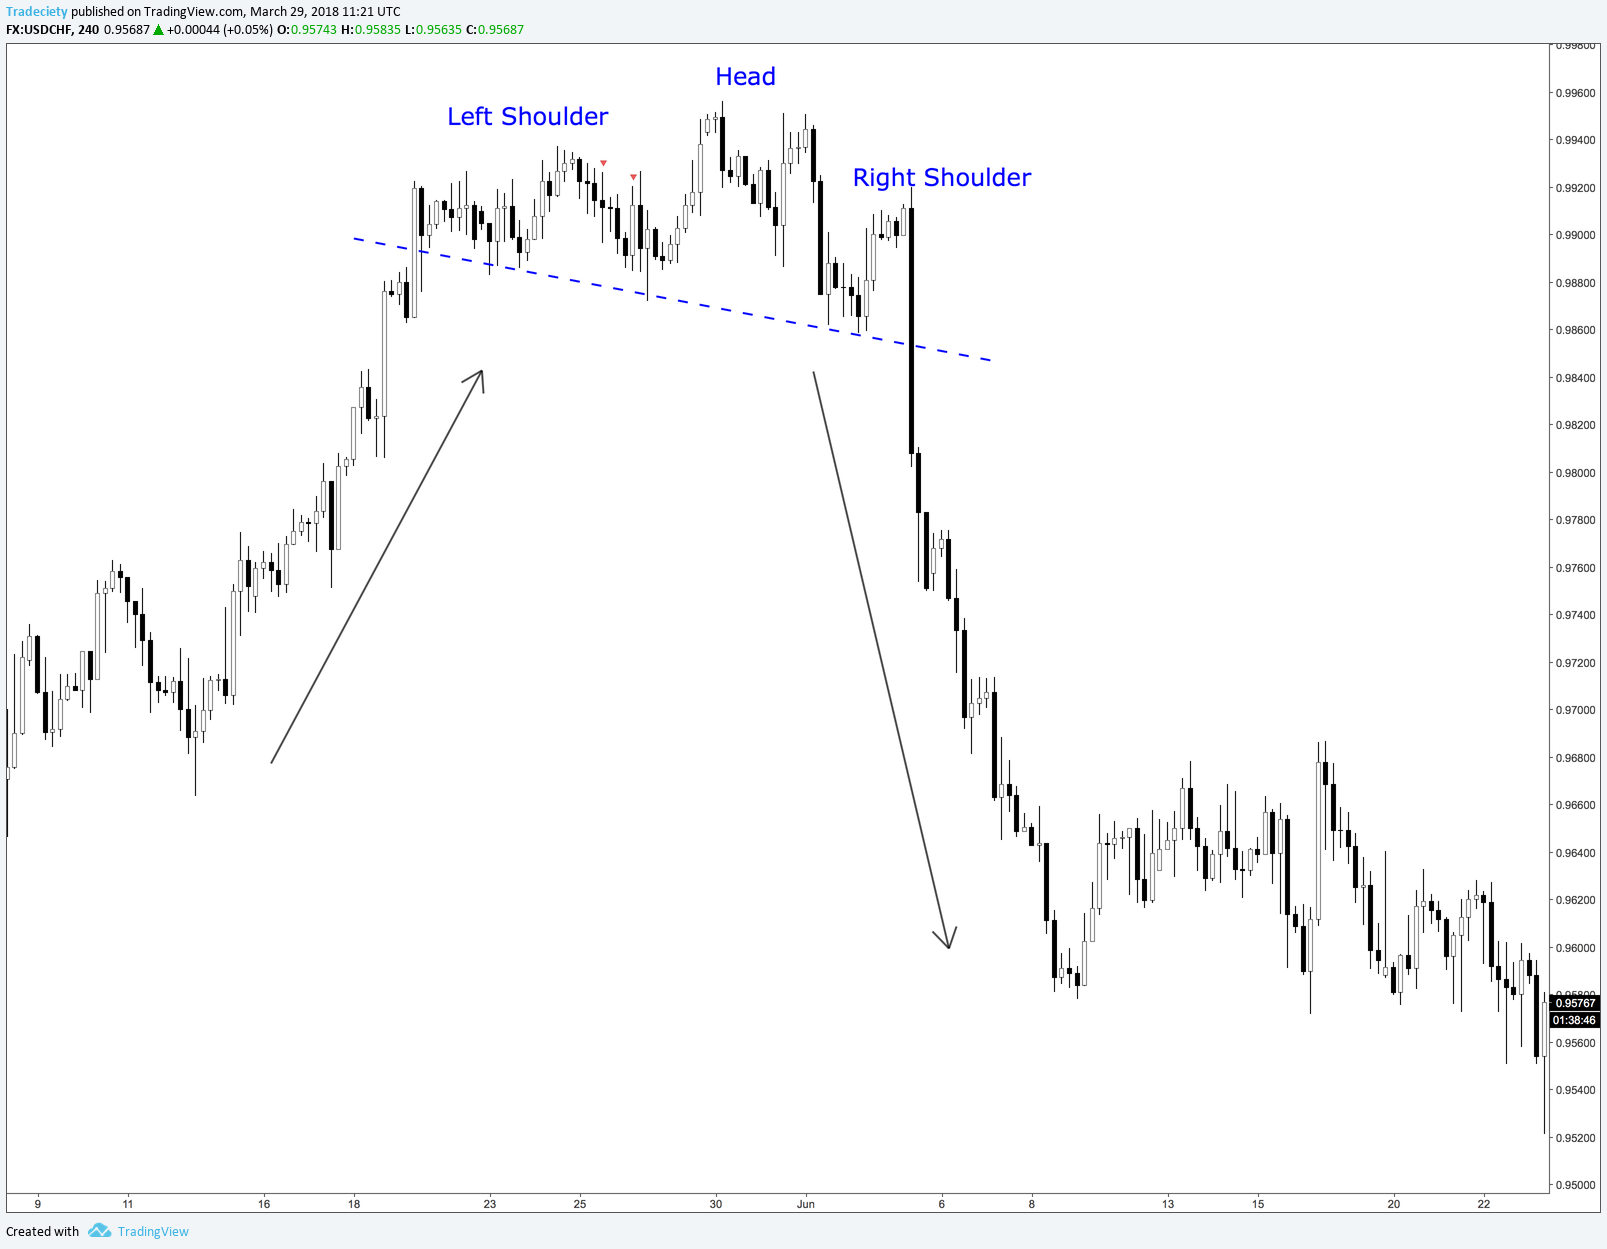
There is so much to the Head and Shoulders pattern and studying it can be a lot of fun. You will learn a lot about the market.
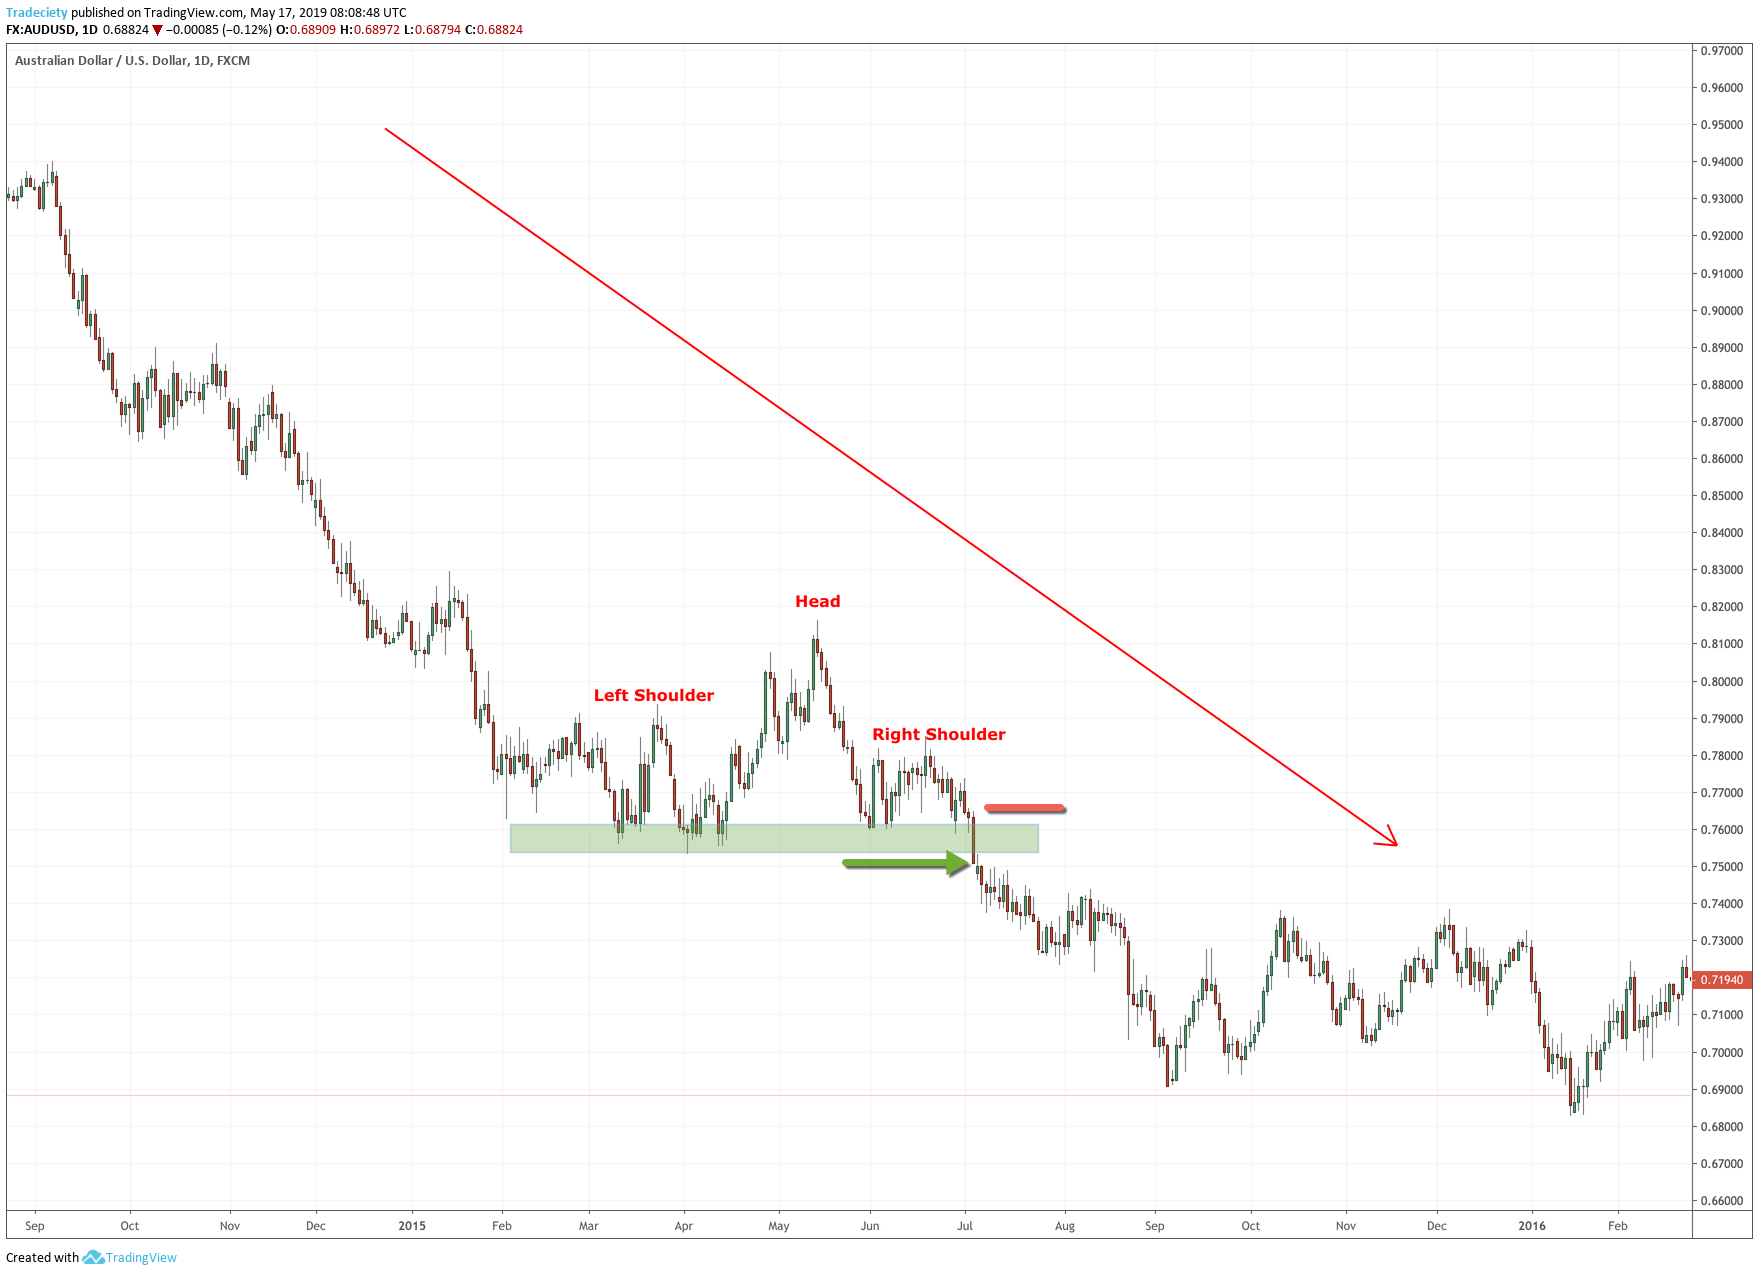
A Head and Shoulder can also occur during an established trend and then look like a breakout continuation pattern. During the primary downtrend, the Head showed a breakout attempt higher but the buyers lacked strength and the right shoulder indicates that the buyers quickly withdrew and the sellers took over again, pushing the price back into the previous low. The breakout is then a continuation.
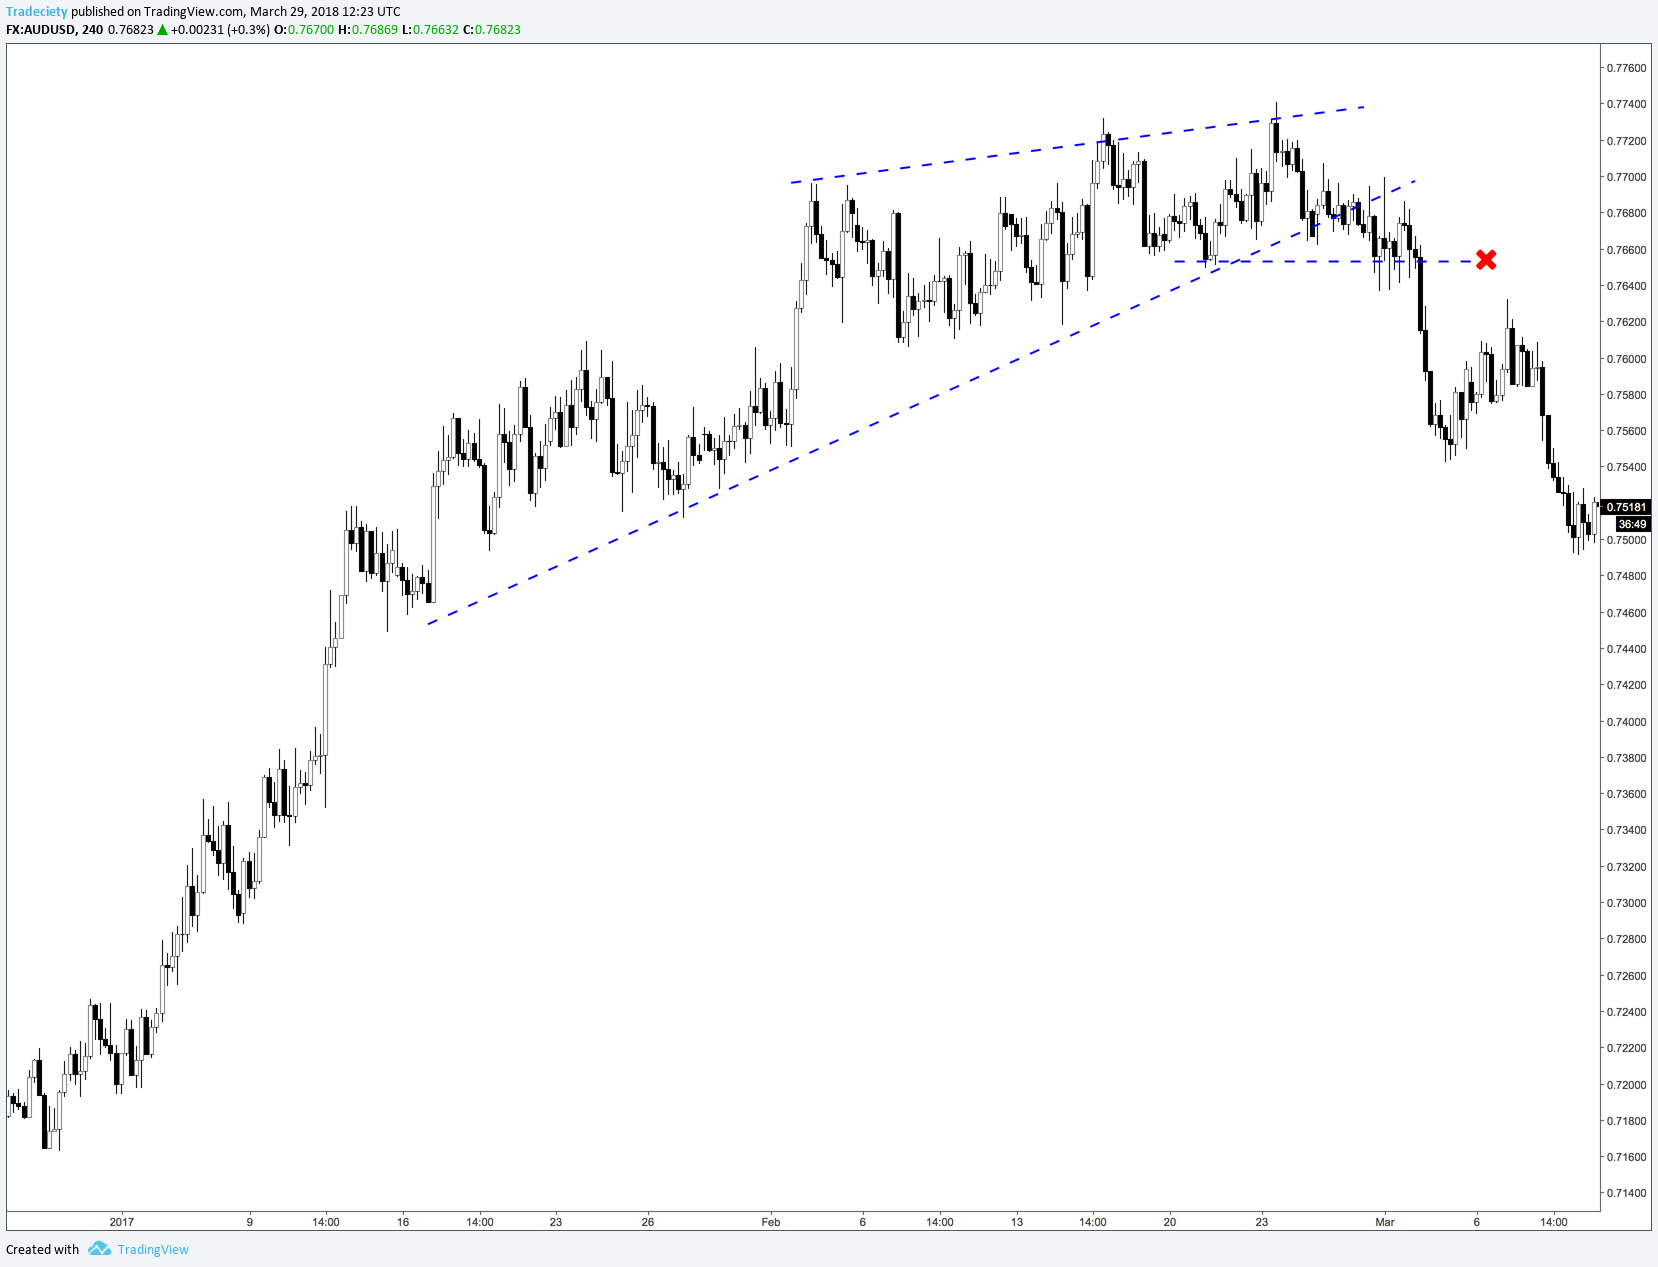
Wedges are trendline-based technical patterns and they also describe market momentum very nicely.
When you pay attention to the upper trendline, you can see that the highs rise only very slowly. When you add a momentum indicator to such a chart, you will also immediately see a divergence confirming the lack of buying strength.
At the top of the wedge, the price barely makes a new high which is a weak bullish signal. Before the breakout (marked with an X), the market completely failed to make a new high. This is an important market tell and foreshadows the upcoming downtrend.
The triple top shows exhaustion of buying pressure. Although the price tried to push into new highs three times, the buyers never succeeded and the price was rejected every single time. If you see price wicks at the upper resistance level of the patter, this further confirms the failed rejections.
In the scenario below we can see how more and more selling pressure built during the triple top. The final breakout was quick and strong. During the top pattern, the big players (banks, hedge funds, etc.) slowly accumulated their large short positions and once there were no buyers left, the pricer fell through the floor until it was low enough to attract buyers again.

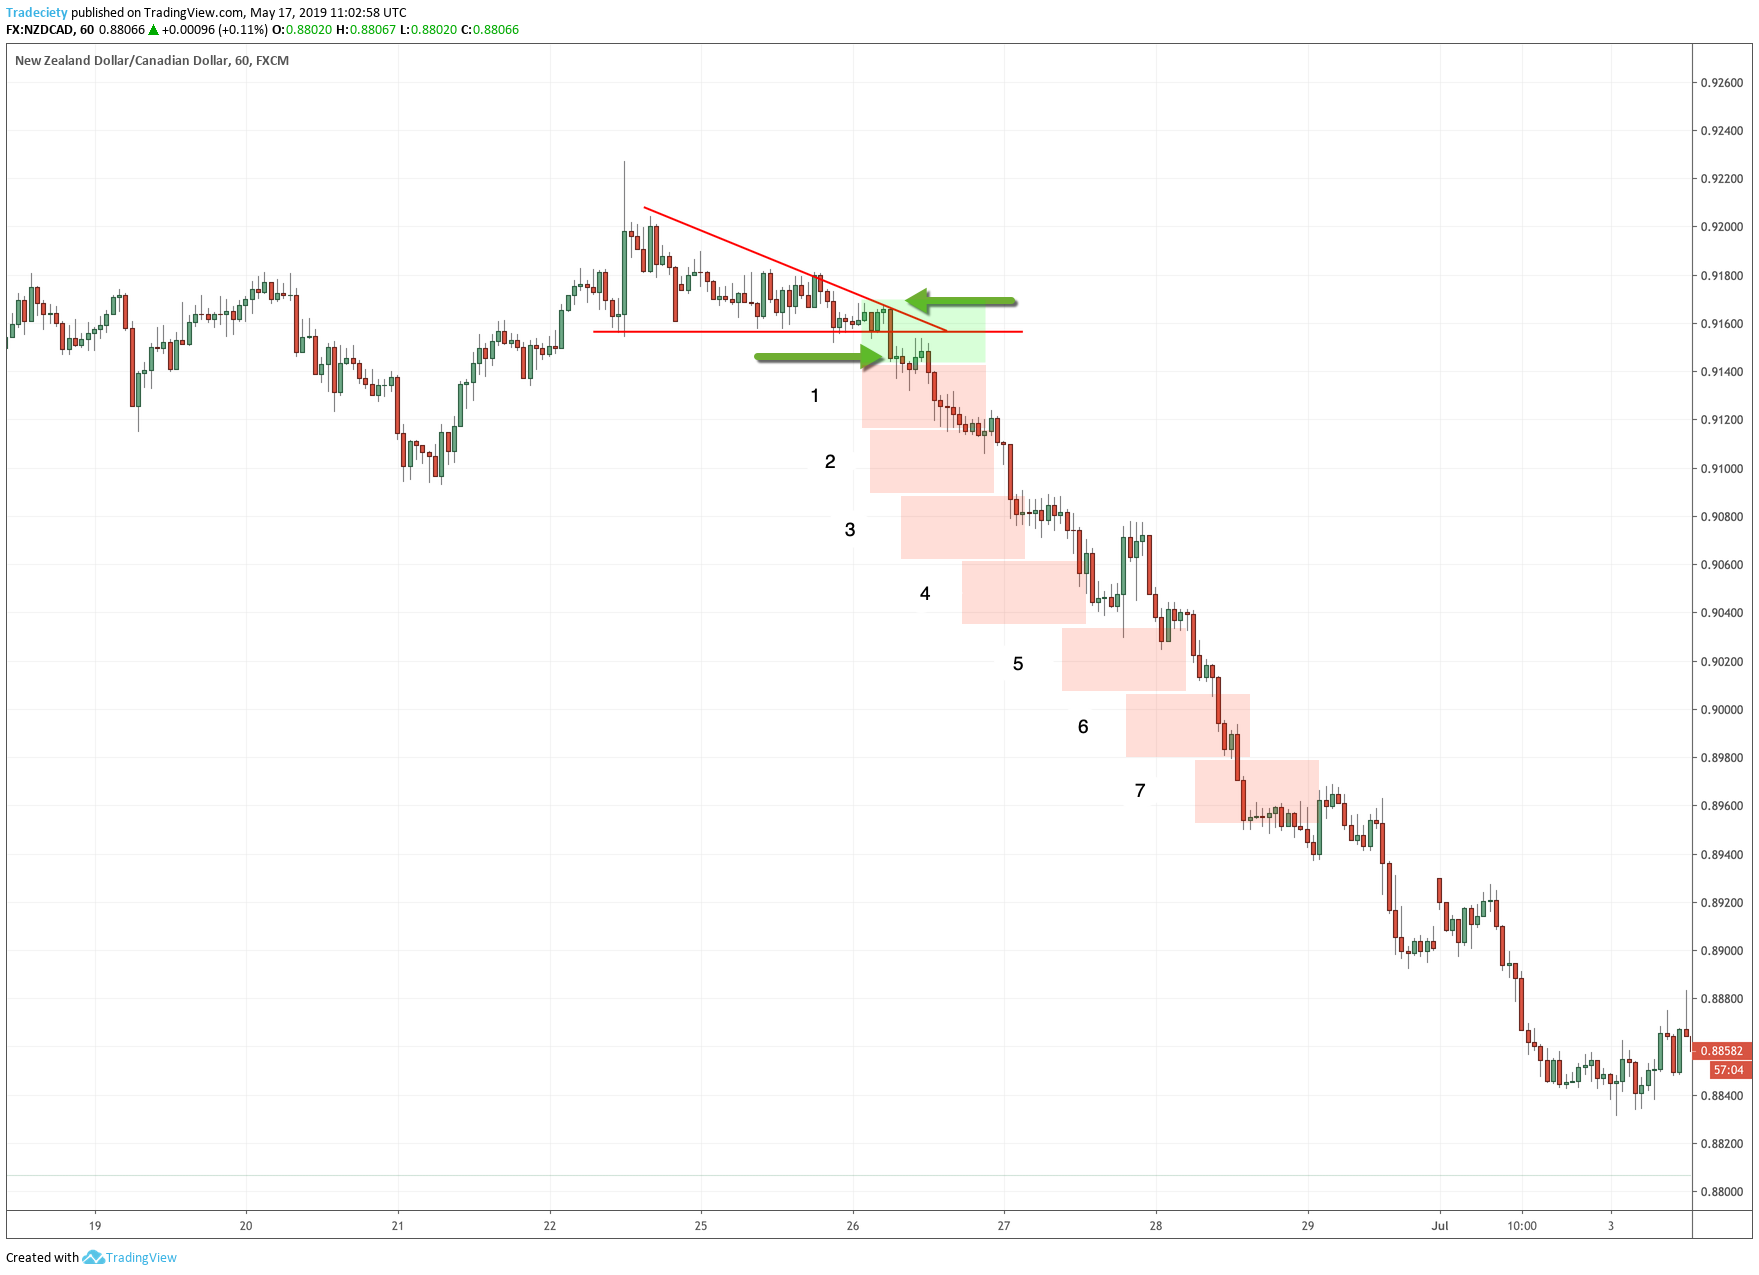
Triangles indicate slowly building selling pressure nicely too. The price keeps pushing into the support level time and again. At the same time, the moves away from the support level become shallower. This structure of lower highs is what builds the triangle. Everything is pointing to a breakout to the downside.
The Cup and Handle is also a fascinating pattern and you can learn a lot from it about market sentiment. The Cup part looks like a double top with 2 highs pushing into the same resistance level. The Handle indicates that although the price was rejected from the resistance level, the sellers were not able to move the price lower that much. The price quickly returns back into the previous high and signals that the buyers are ready to take over. The breakout then signals the bullish shift.
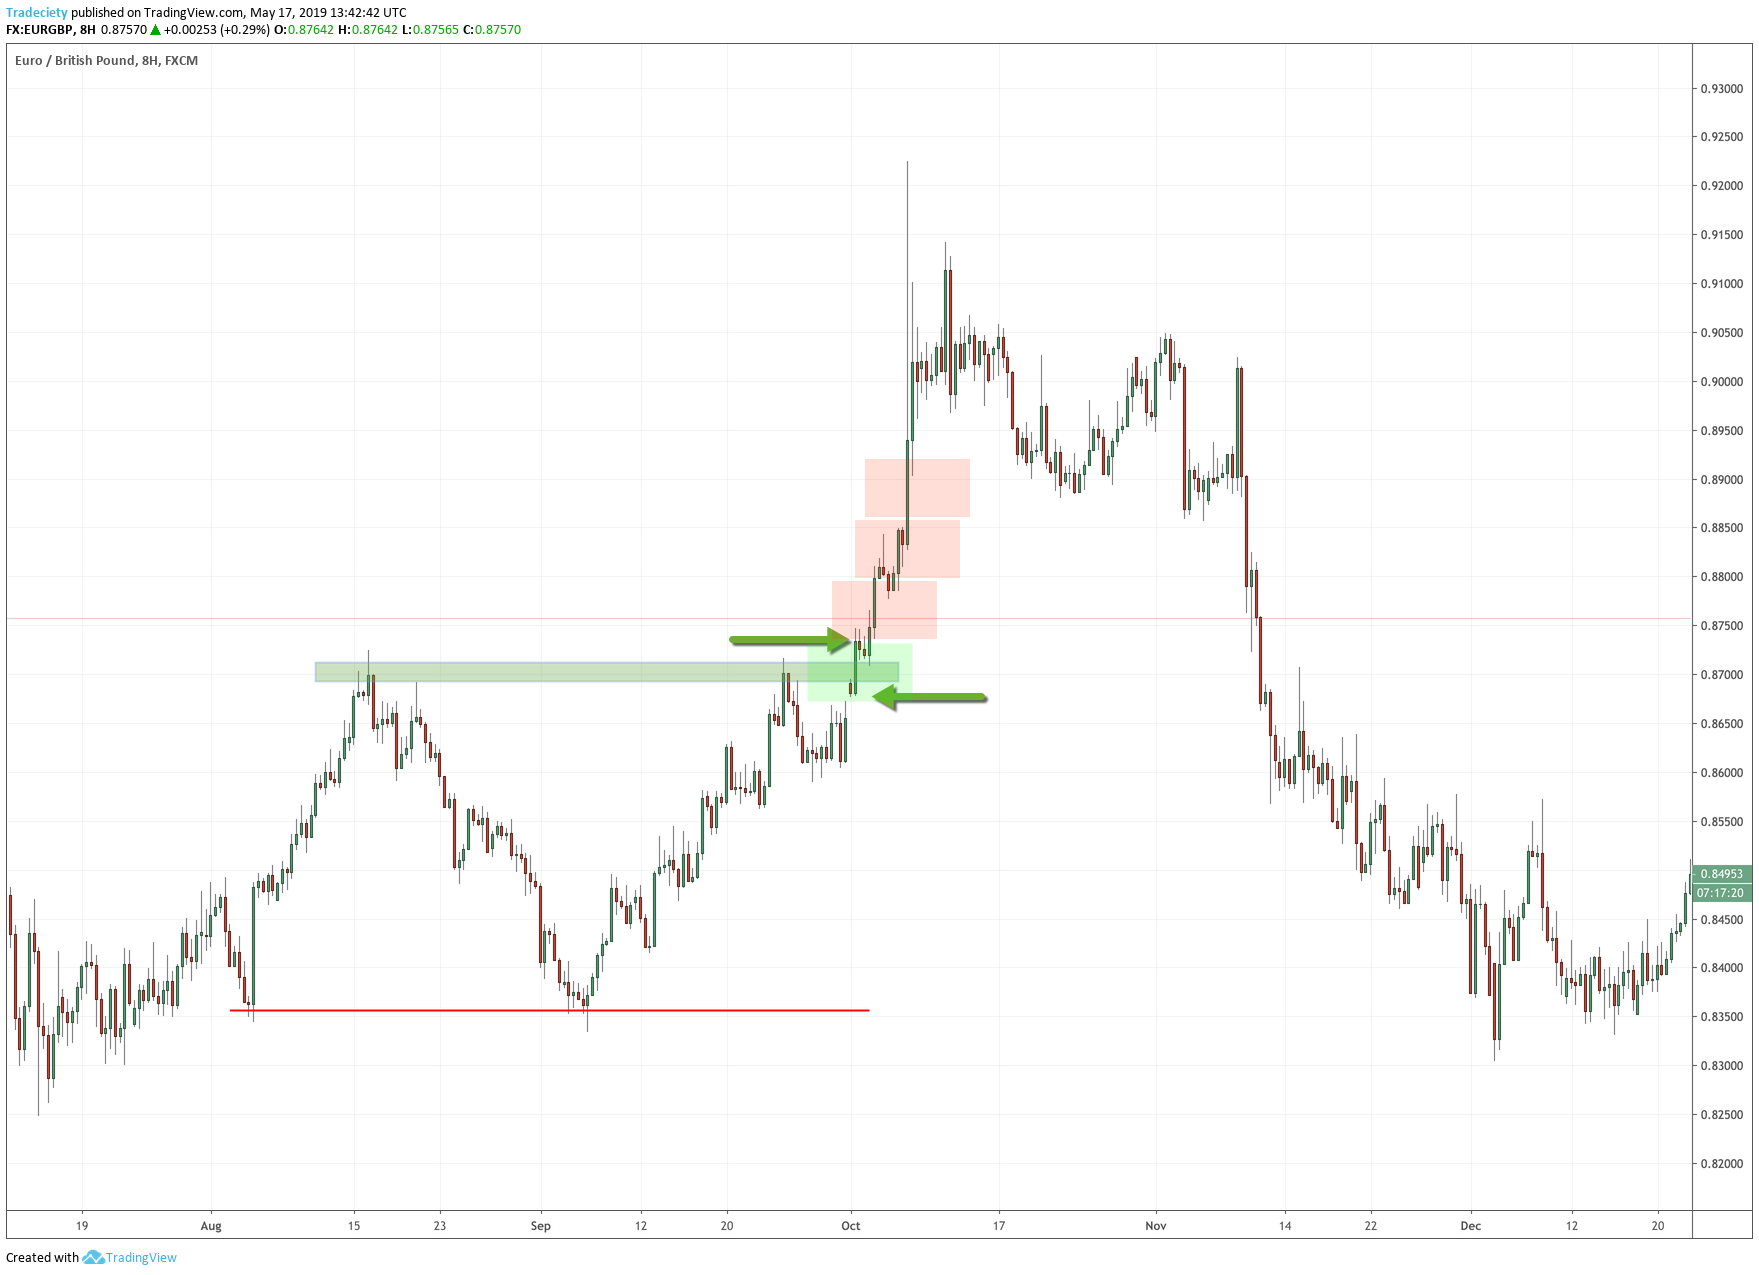
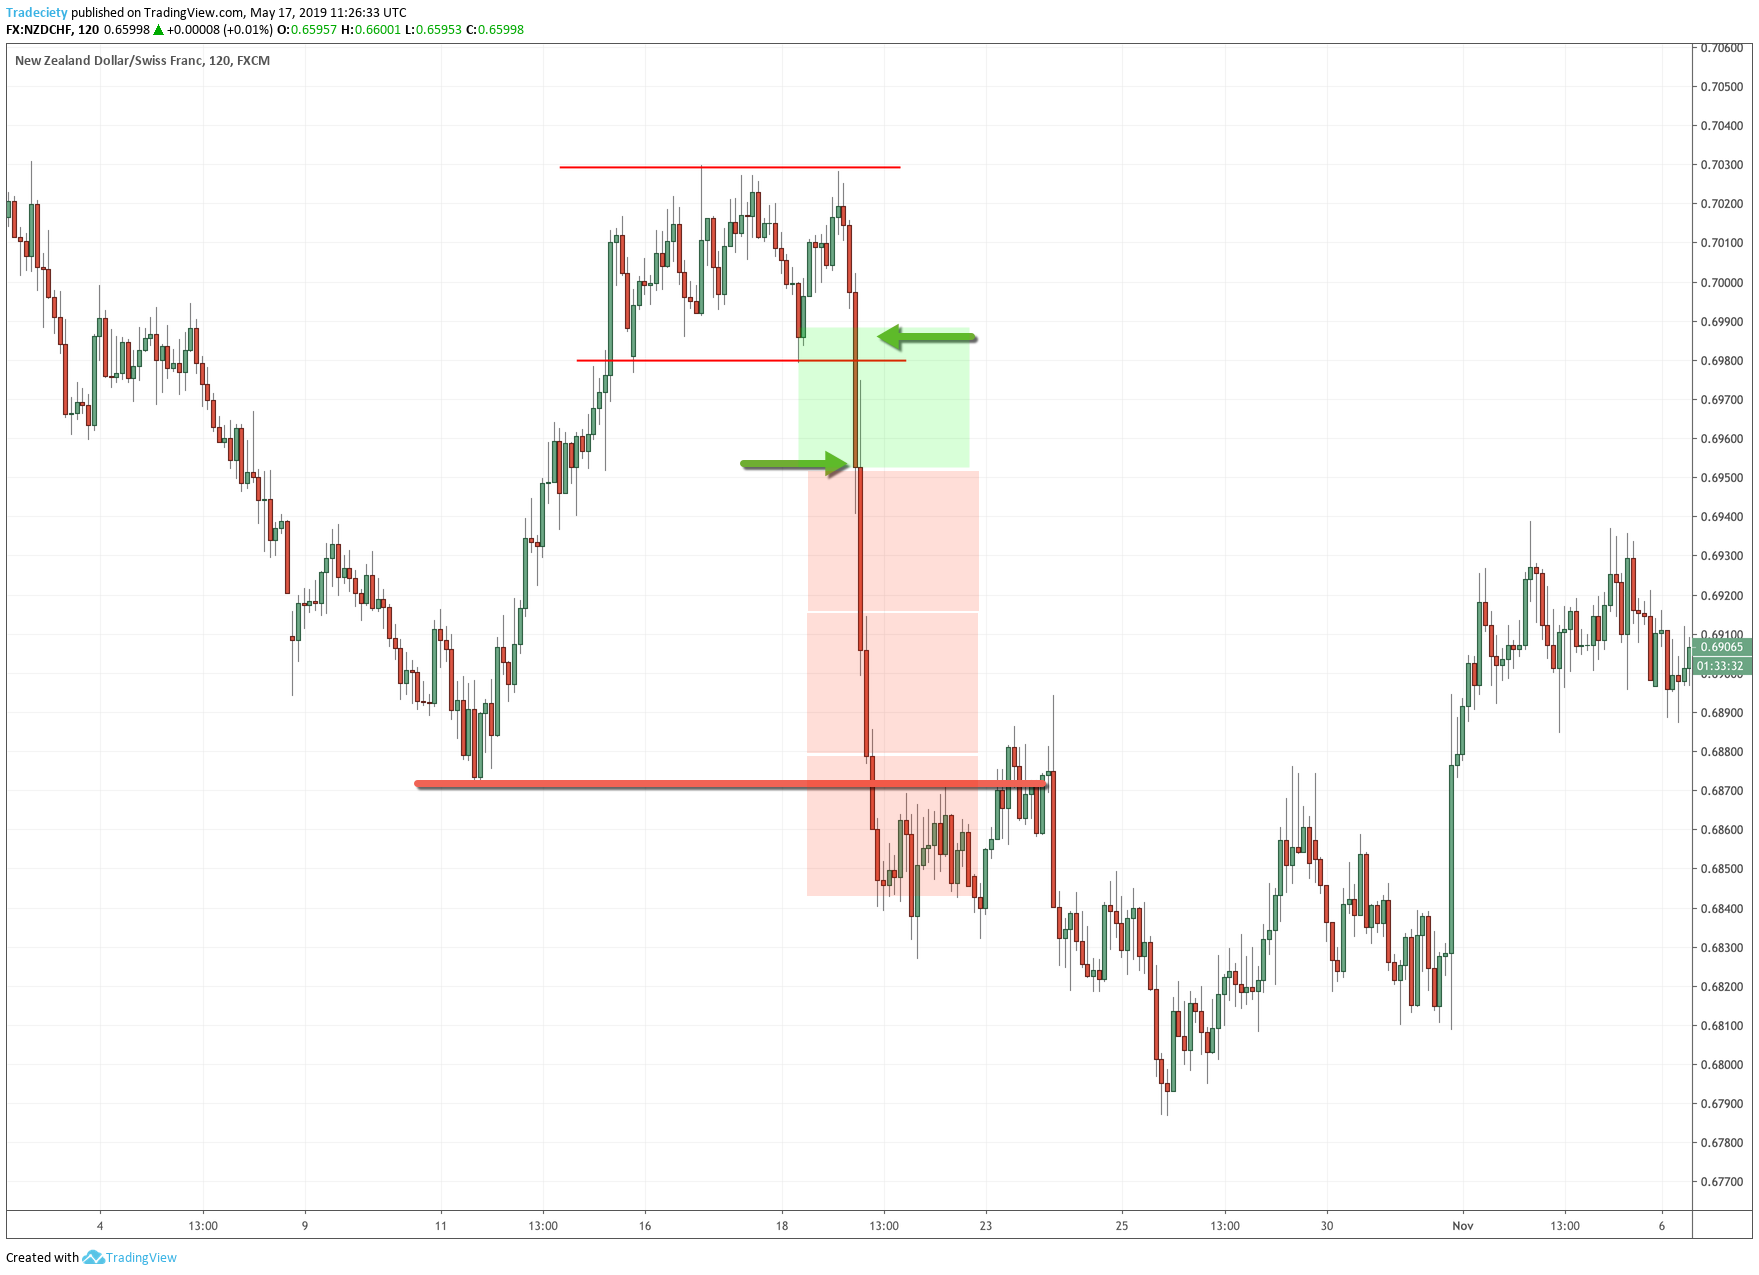
Whenever you look at a potential breakout, always ask yourself: How does the price trade into the level? During the premium courses, you will often hear me say that. It seems like such a small detail but it can tell you a lot about what is going on.
The scenario below shows a multi-top structure. The price repeatedly failed to break out higher. Then, when the price returned to the support level, the price did not break out immediately but made one small last pullback. I call this the “lower bounce” and it is a great add-on to any technical pattern. The small pullback shows that, although the buyers somehow tried to take control, the sellers stepped in right away and didn’t allow the price to rise a lot. This is a very important piece of information and can indicate a high-probability breakout.
We saw the lower bounce in this article for the wedge, the triangle, the Head and Shoulders, and even in the Cup and Handle.
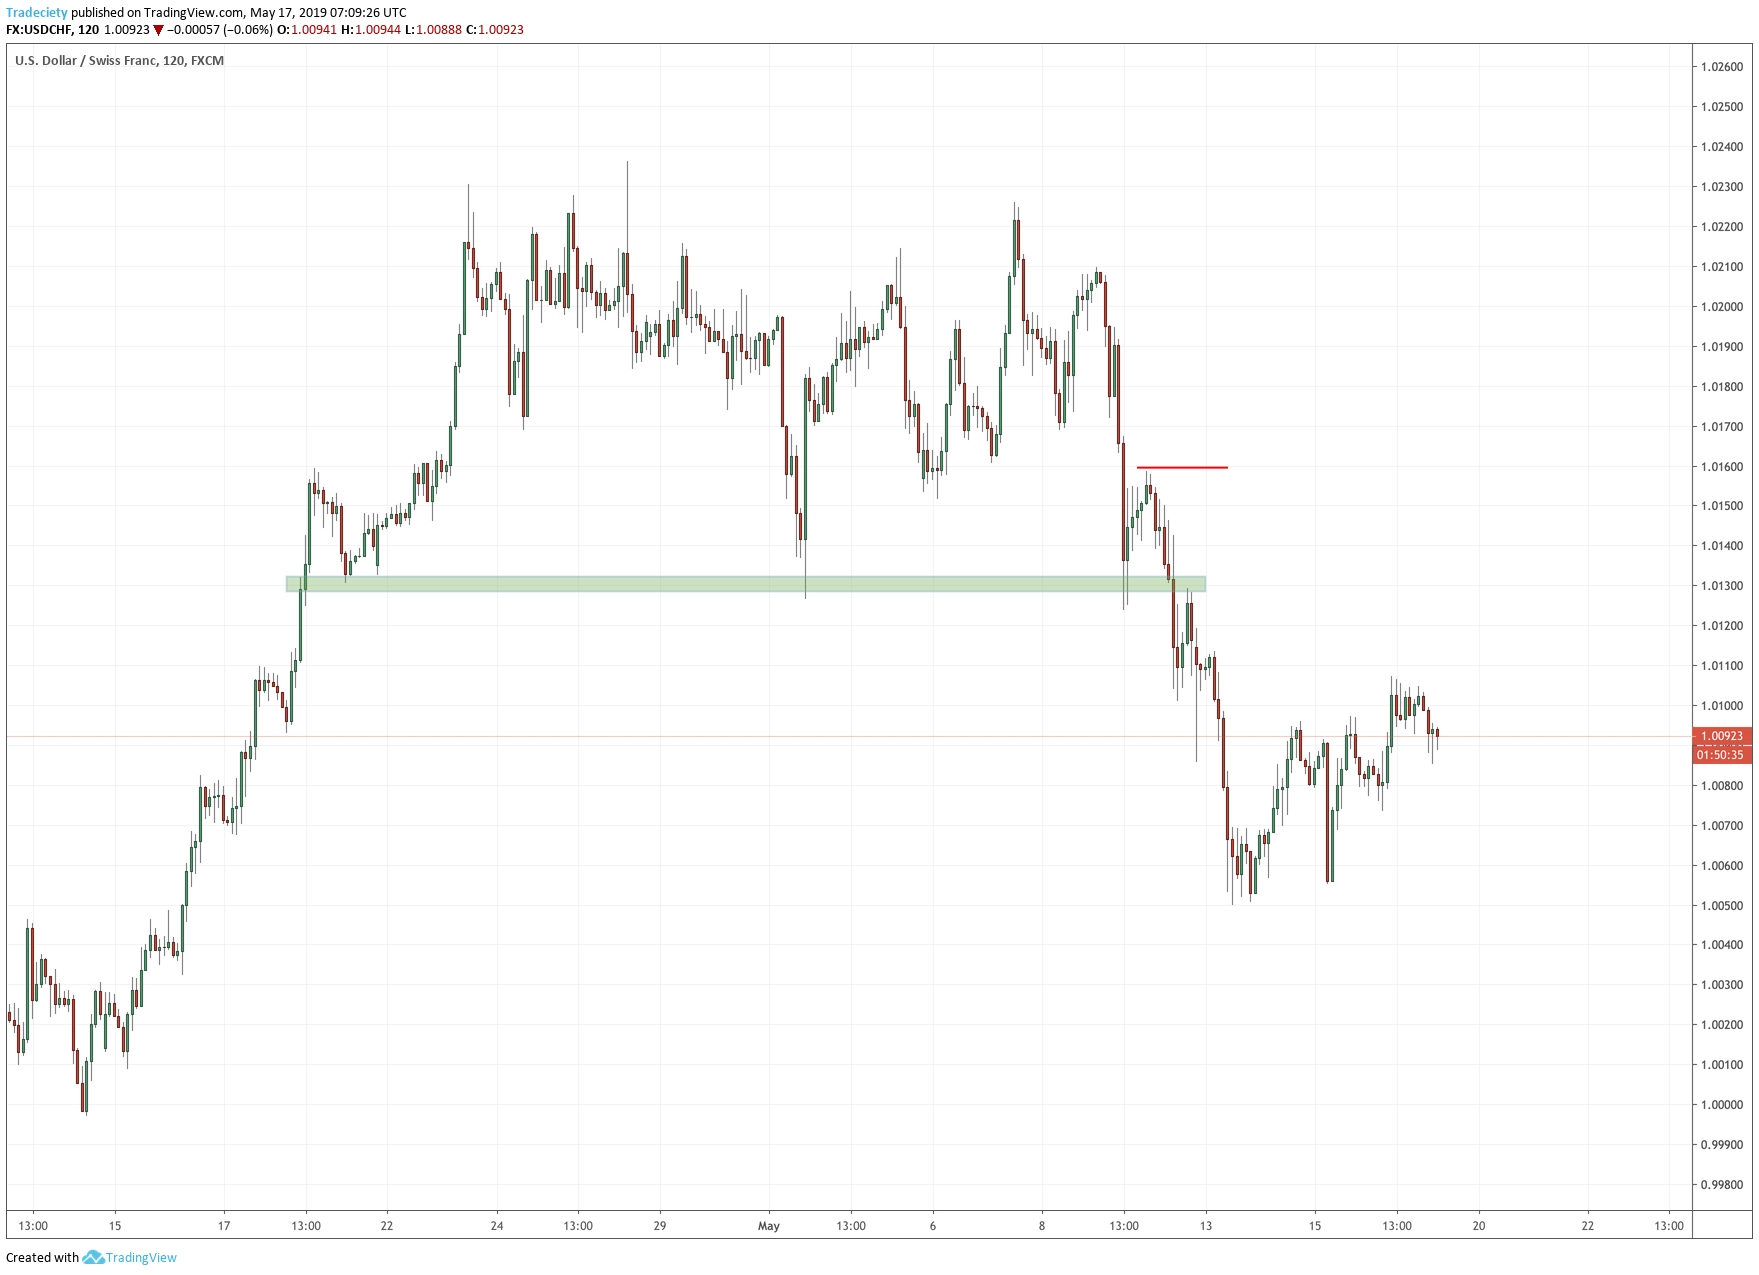
Retests happen frequently after a breakout. When the market pulls back into the breakout level, this is what traders refer to as a retest.
Retests can also be used as additional entry patterns. Furthermore, it also indicates that the use of “breakeven stops” should mostly be avoided to break out trading because the retests target your breakeven stops.
In our last pullback strategy article, we talked about various retest and pullback trade studies.

Breakouts are such a great way of looking and understanding price action. It really pays off to look deeper into breakout trading and get away from the amateur template-thinking. When you can pick up the little nuances the chart patterns tell you, you will start seeing price action in a completely new light.


external link:
external link:

3 min read
The following is a guest post from Michael Lamothe.
I'm Michael Lamothe, and today marks an extraordinary milestone: the first anniversary of "The...
3 min read
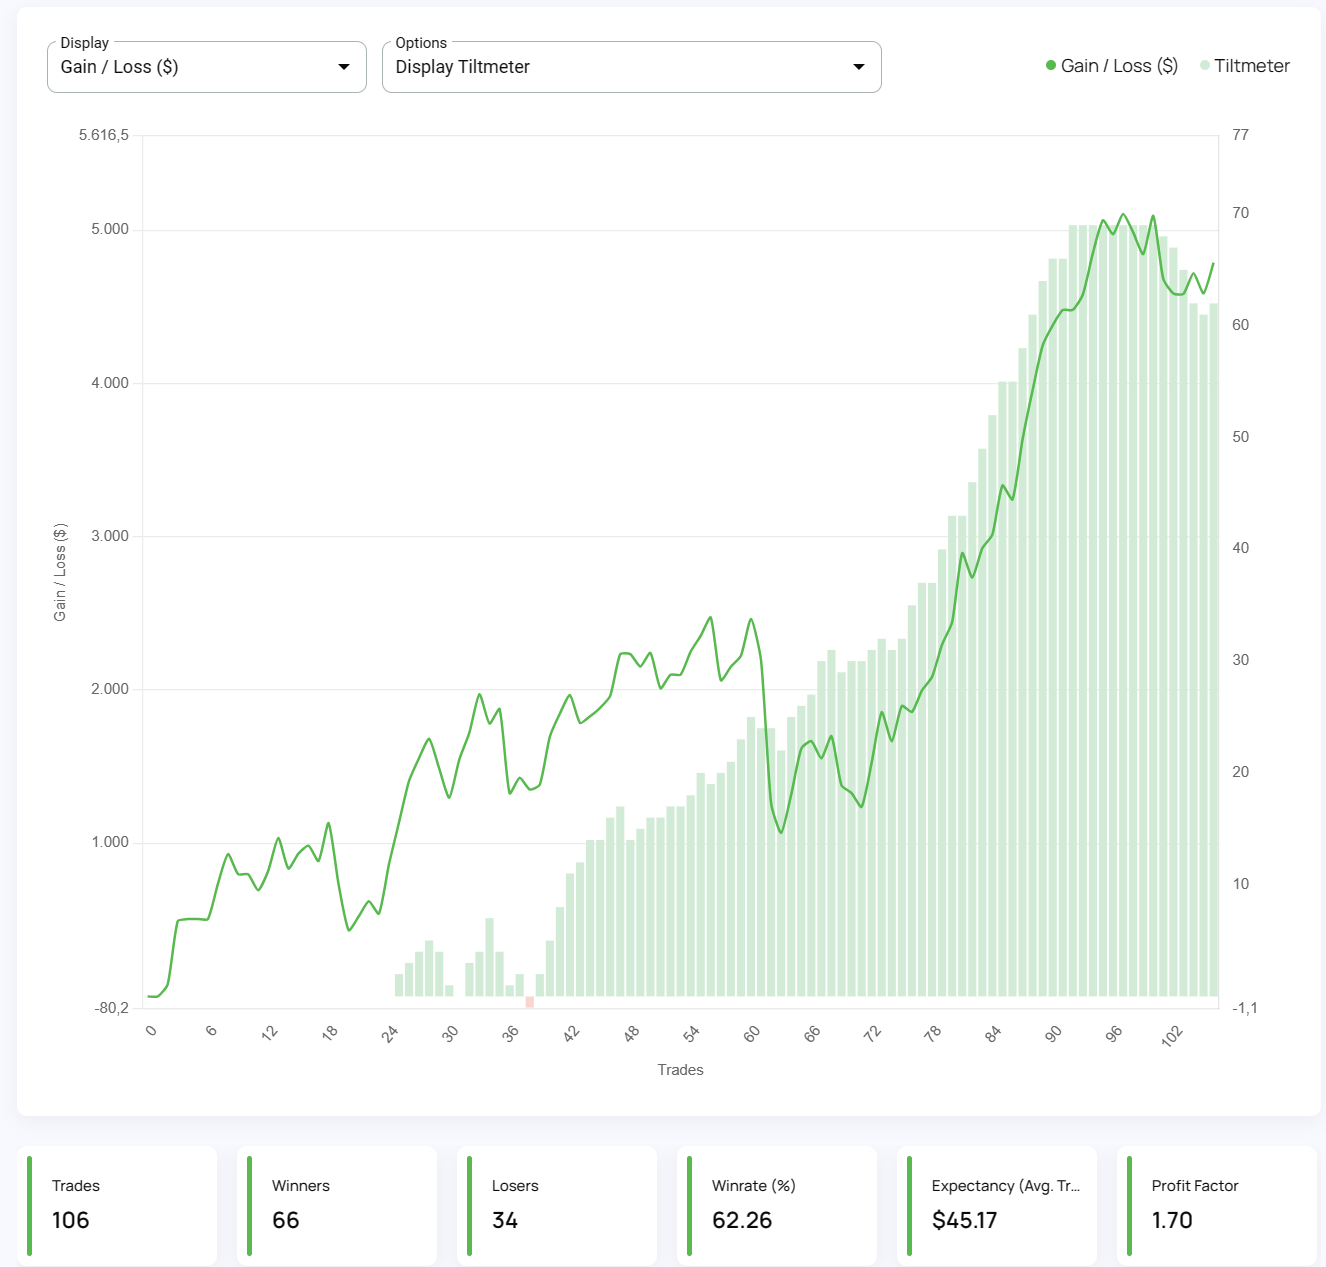
It's easy to get discouraged by losses and question your every move. But what if there was a way to track your progress, learn from mistakes, and...

8 min read
Dive deep into the world of finance and high-stakes trading with this selection of movies and documentaries! From the exhilarating thrill of...