Supply and Demand Trading in 2026
We have been trading supply and demand strategies for over ten years, and they have stood the test of time remarkably well. Supply and demand is...

Stop losses are very misunderstood in general retail trading. However, it must be clear that you can never enter a trade without a stop loss. Not only because you run the risk of losing way too much on a single trade, but you also can not size your positions and easily become the victim of emotional trading mistakes.
Following a consistent stop loss approach is very important because it takes out the emotional and impulsive aspect of taking losses that so many traders struggle with. If you don’t really know where your stop goes, and you just put it at a random level, you are much more likely to mess with your stop – widening the stop that is in most cases – when price moves against you.
On the other hand, when you know where your stop goes (and why you place it there), because you use the same approach every single time, you will feel less tempted to break your stop loss rules and adhere to the initial plan.
We show you 6 ways, tools and concepts that can be used for stop placement and we explain the benefits and disadvantages of every single one.
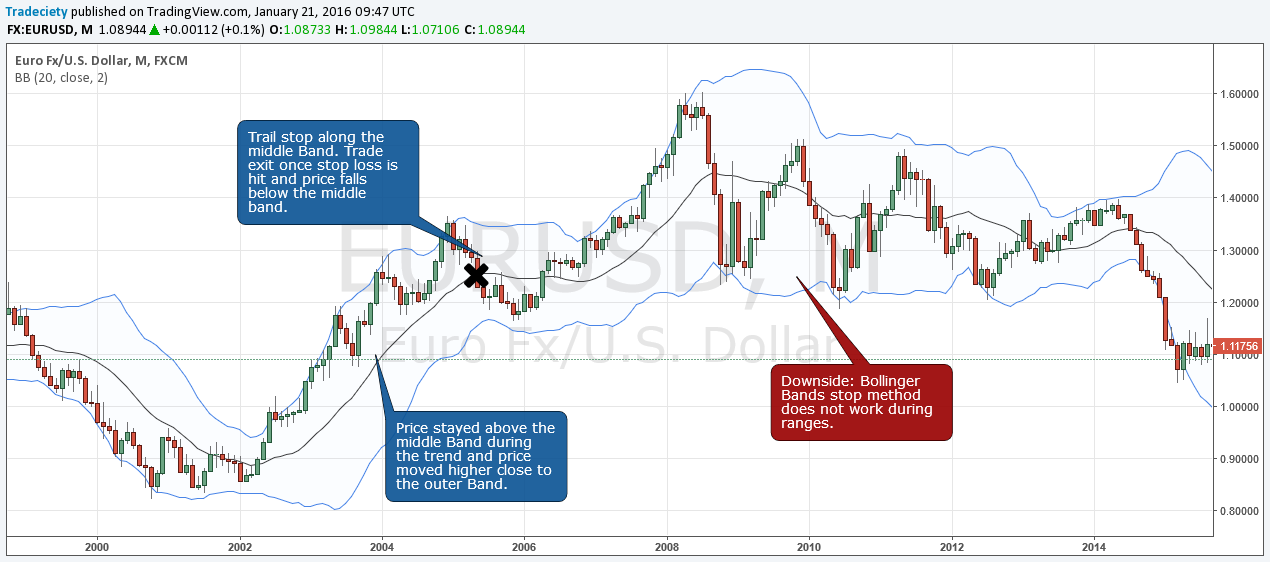
Especially for trend following traders, the Bollinger Bands © are a great tool for stop placement and for trailing your stop. In an uptrend, you typically see that price moves higher close to the outer Bollinger Bands. A trend that is losing momentum will start pulling away from the outer band and gravitate towards the middle band. Keep in mind that the middle band is a moving average so it makes sense that during a trend price pulls away from the average and once price loses momentum, it comes back to its average.
Thus, trend following traders would place their stop above/below the middle band and trail it along with it as the trend moves on. A trader who prefers a more conservative strategy would place his stop outside the opposite outer Bollinger Band.
Further reading: How to trade the Bollinger Bands
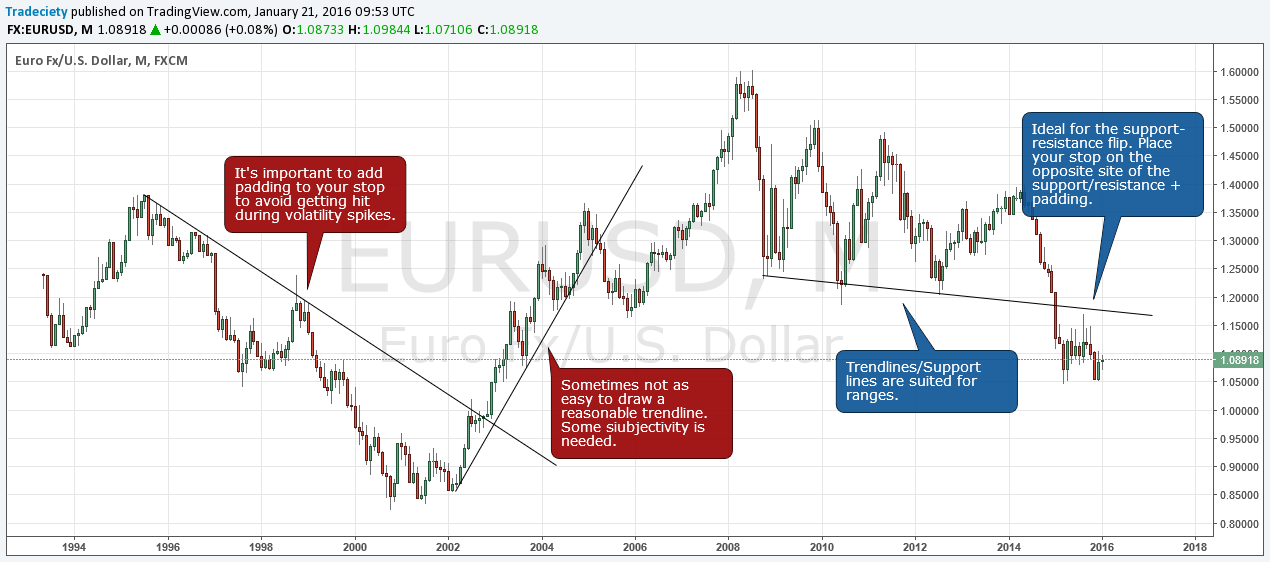
Trendlines are a famous tool when it comes to stop placement. As a natural support and resistance level, trendlines are used by many traders and, thus, the self-fulfilling prophecy plays into this equation as well.
A trendline-break often signals the end or the weakening of a trend and it makes only sense to have your stop on the other side of a trendline so that you exit your trade when clear price signals are given.
The downside is that drawing trendlines can be subjective sometimes as it’s not always clear if you should go for the wicks or the candle bodies. Hence, we suggest drawing trendlines connecting the extremes (price wicks) so that you are on the safer side when it comes to stop placement and avoid false signals during premature volatility spikes.
Adding a few points as a buffer between the trendline and your stop is recommended. It is well known that many traders use trendlines and horizontal lines for stop placement and they make an easy target during squeezes.
Further reading: Using support and resistance zones for better trading
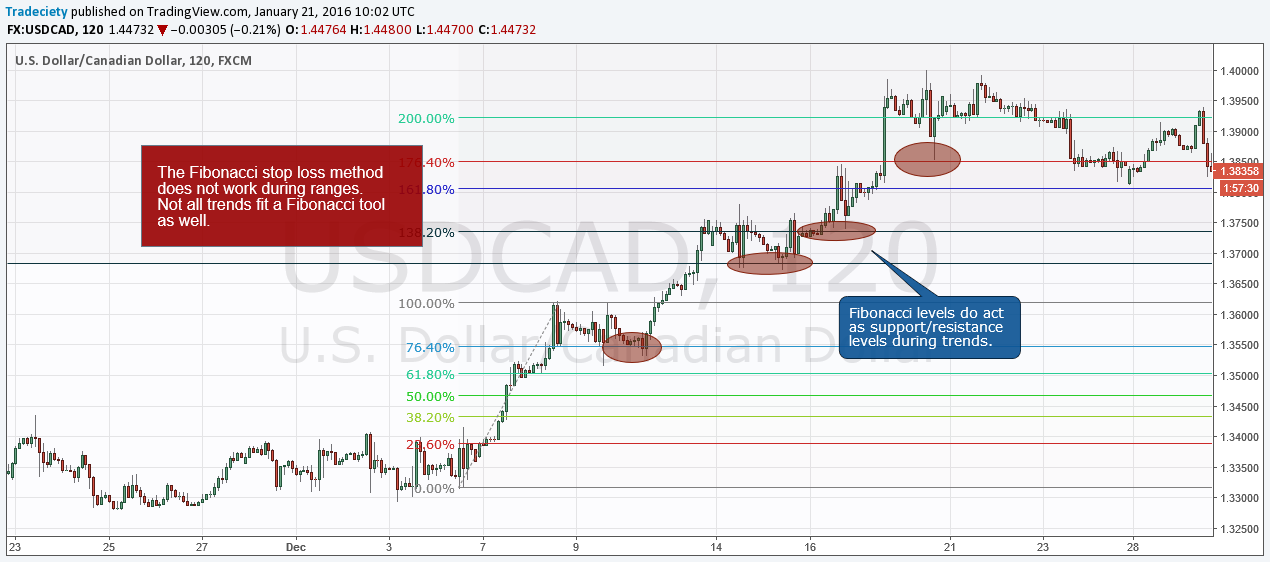
Fibonacci levels also act as support and resistance and, thus, the concepts of support/resistance stop placement also apply to the Fibonacci method. After you have identified a potential trade entry and also found a reasonable 1-2 sequence for your Fibonacci tool, you can use the retracement levels as stop loss levels.
The disadvantage is that you are not always able to find a 1-2 sequence, especially within ranges or early on in a trend, and thus, using the Fibonacci method won’t work 100% of the time.
We have briefly touched on moving averages when talking about Bollinger Bands. When the price is in a trend, price pulls away from its moving average as the trend accelerates. When the trend slows and reverses, prices will revert back to the average.
The “well known” moving averages, such as the 50, 100, 200 daily moving averages act as natural support and resistance. Thus, it can pay off to have them on your charts and place your stops outside of those moving averages.
Generally, you do not want to place your stop loss right at a moving average, but add some space between the moving average and the stop loss. It is well known that traders use moving averages for their stop loss placement and stop runs are often the consequence.
Further reading: The ultimate guide to trading moving averages
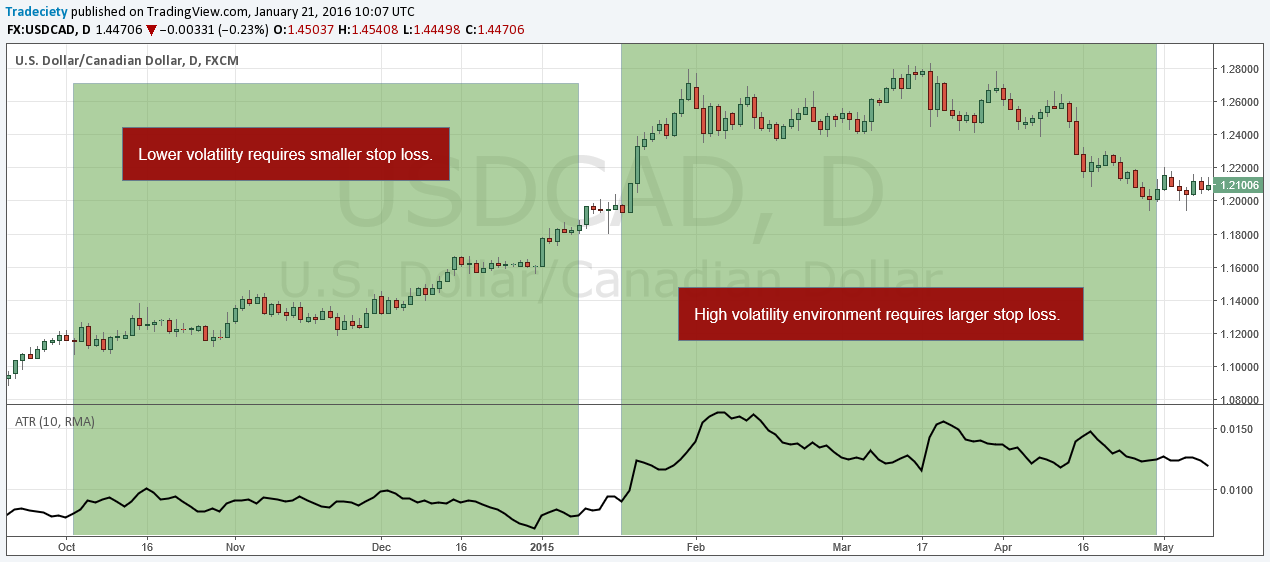
The ATR stop loss approach is a so-called dynamic approach since the size of the stop varies based on market volatility. When the ATR is high, volatility is high and price moves and fluctuates more. In such a case, the trader would use a wider stop loss because the market moves more. Thus, the ATR helps you adapt your stop loss approach to the current market environment.
At the same time, you could use a wider take profit as well since the market swings more in both directions. Thus, your reward/risk ratio could be kept stable when you adjust both your stop loss and the take profit at the same time with the help of the ATR.
On the other hand, when volatility is low and the ATR shows a low value, you’d use a smaller stop loss because the price does not move as much and a wide stop loss is not necessary.
The benefit of the ATR approach is that it works well with almost all other stop methods. If, for example, you are using support and resistance for your stops, you would simply add a bit more padding when the ATR is high.
Tip: The Keltner Channel visualizes the ATR on your charts and makes it easy to use the concept of ATR for your stop placement.
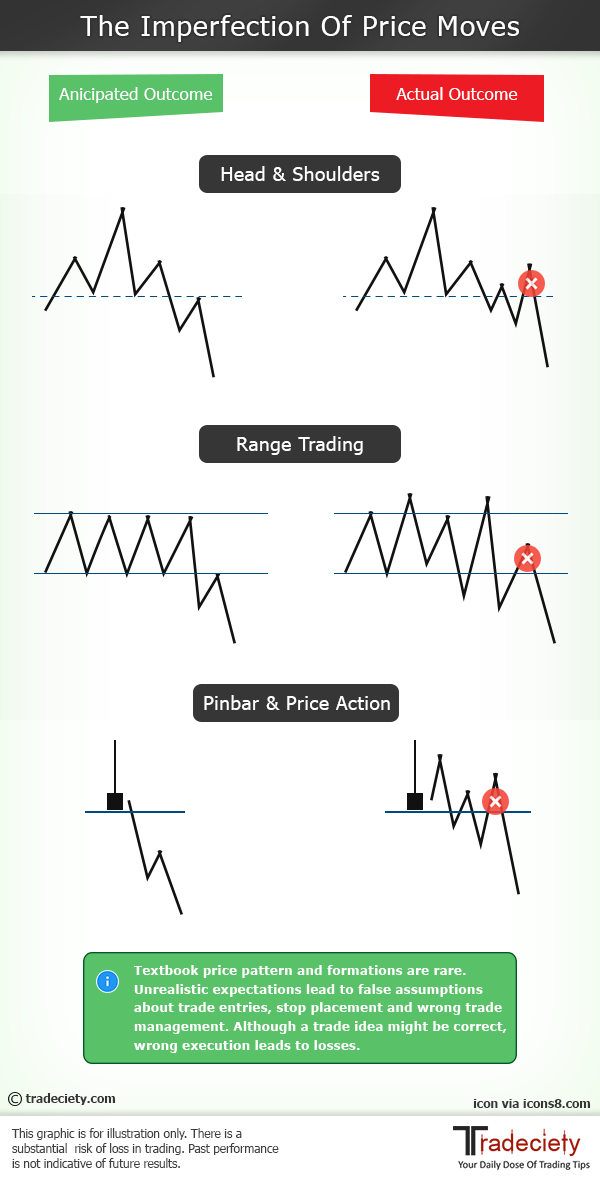
This last concept is probably among the most commonly used strategies for stops. When you are trading pin bars, you just place your stop above/below the high. When you trade a Head & Shoulders, you enter on a break of the neckline and place your stop on the other side of the line. And traders who enter trades during pullbacks will typically place their stop just above/below the high/low.
The downside is that such stop loss placement is well known and often easy to spot. It is usually called stop-loss hunting and it is not your broker that is hunting the stop loss, but the “smart traders” who can read from their charts where the amateur traders place their stop losses.
right-click , save picture as
The concept of the time-stop applies to all previously mentioned stop loss techniques. If you enter a buy trade at a certain price with the rationale that price should go up, but it doesn’t and price just keeps hovering around your entry price, your analysis was wrong and the trade does not work out as anticipated. Staying in a trade where your idea is proven wrong right after the start is a gamble and you are not in a high probability trade. If you have the chance to get out cheaply, get out and don’t hope for something to happen.
Many professional traders use this concept when their trade idea is not immediately validated. Usually, upon entering a trade, you would like to see price move into profits right away. If the price does not move in your favor, you’d close the trade with the time stop concept right away.
external link:


We have been trading supply and demand strategies for over ten years, and they have stood the test of time remarkably well. Supply and demand is...

3 min read
Choosing the right trading journal is essential for traders wanting to analyze performance, refine strategies, and improve consistency. In this...

3 min read
“95% of all traders fail” is the most commonly used trading related statistic around the internet. But no research paper exists that proves this...