3 min read
A Year with "The Trading Mindwheel": Transforming Trading Through Psychology
The following is a guest post from Michael Lamothe.
I'm Michael Lamothe, and today marks an extraordinary milestone: the first anniversary of "The...
Whether you are a price action, a pattern, an indicator or whatever trader, if you are able to identify strong price levels on your charts, it can greatly improve the quality of your trading.
Instead of taking signals and trades all over the place, the better trades usually happen at key price levels. Those strong areas of interest show that buyers and sellers are concentrating at those levels and they can be the starting or turning points for new price moves and mark new trends as well.
If you are a breakout trader, you need to find areas that can lead to strong breakouts, if you are a trend-following trader you must identify pullback areas or trend continuation points, a reversal trader looks for key turning points and a range trader should focus on well-developed ranges with clearly defined price levels.
The 7 following concepts and tools will help any trader improve their way of identifying key price levels and so potentially improve the quality of their trading.
Most traders are constantly chasing the next move and they are jumping from market to market and from timeframe to timeframe. Instead, you should have a process in place where you first identify the most important key price areas for the day or the week and then let price come to you. This is a more professional and structured way of approaching trading and you can also leverage the benefits of price alerts which you place at or in front of your key price areas to get notified about important developments which then eliminates the need to stare at charts all day long.
Moving averages are a tool used by many traders and even the financial media often talks about famous moving averages from time to time. Often it can seem as if moving averages work like a self-fulfilling prophecy because so many traders use them.
For that exact reason, I recommend using the most famous moving averages because if the effectiveness is built on the self-fulfilling prophecy, this will enhance the effectiveness.
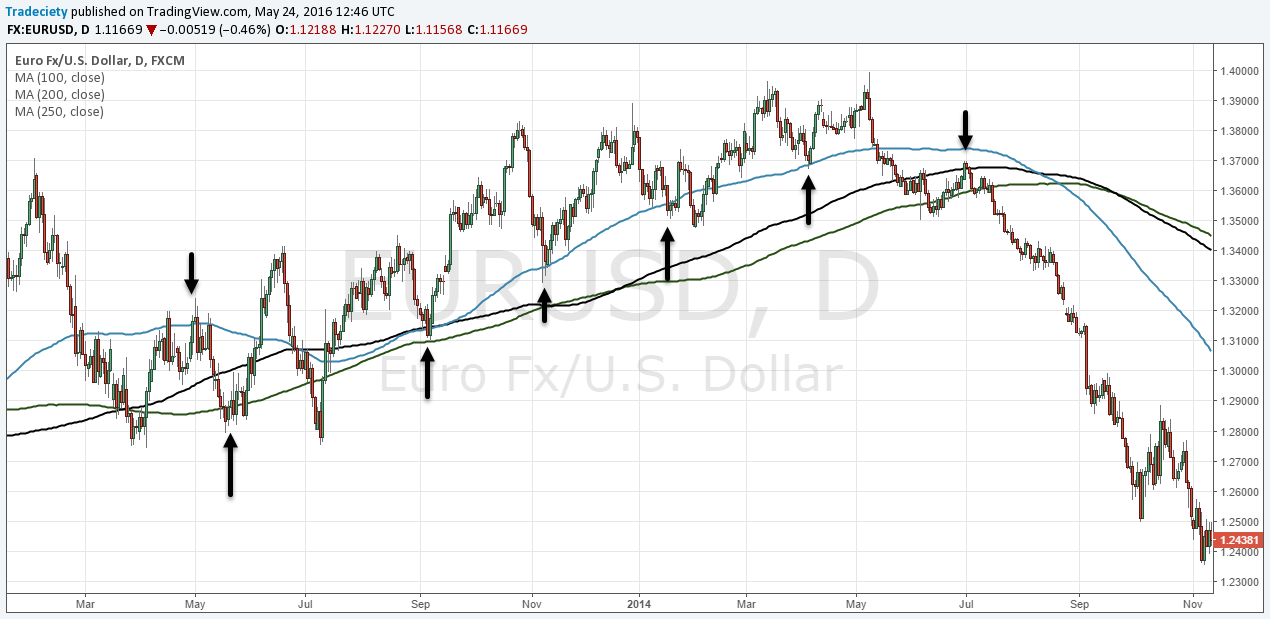
Especially the 250, 200, 100, 50 and 20 period moving averages on the daily and the higher timeframes are worth having on your charts when it comes to finding key support and resistance areas.
During ranges, moving averages lose some of their validity, but during trending markets, you’ll see that those moving averages work very accurately. Especially trend-following, reversal and pullback traders can use those concepts.
The screenshot shows how price uses the moving averages first as a pullback area and then once the moving averages have been broken, price retests the levels again.
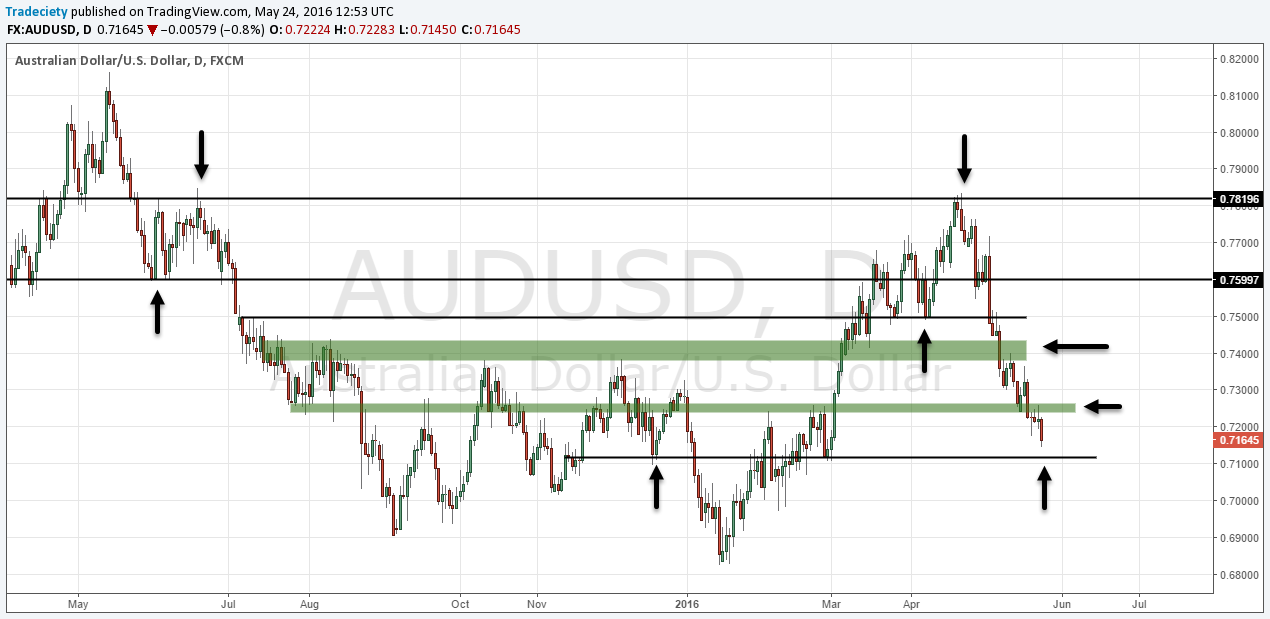
In my own trading, I heavily rely on high impact support and resistance levels. Higher timeframe support and resistance levels and zones are well respected and they add a great layer of additional confirmation and confluence to your trading.
I especially look for strong and impulsive turning points where price has previously shown a strong reaction because it implies that there is a lot of buyer and seller interest in such an area and price is likely to show another reaction as well.
So my tip for you would be to focus on major turning and reaction points when drawing support and resistance and forget about all the little levels in between. Many traders make the mistake of cluttering their charts with all the levels they can come up with and then end up with charts full of lines and then unable to get into trades because everything scares them.
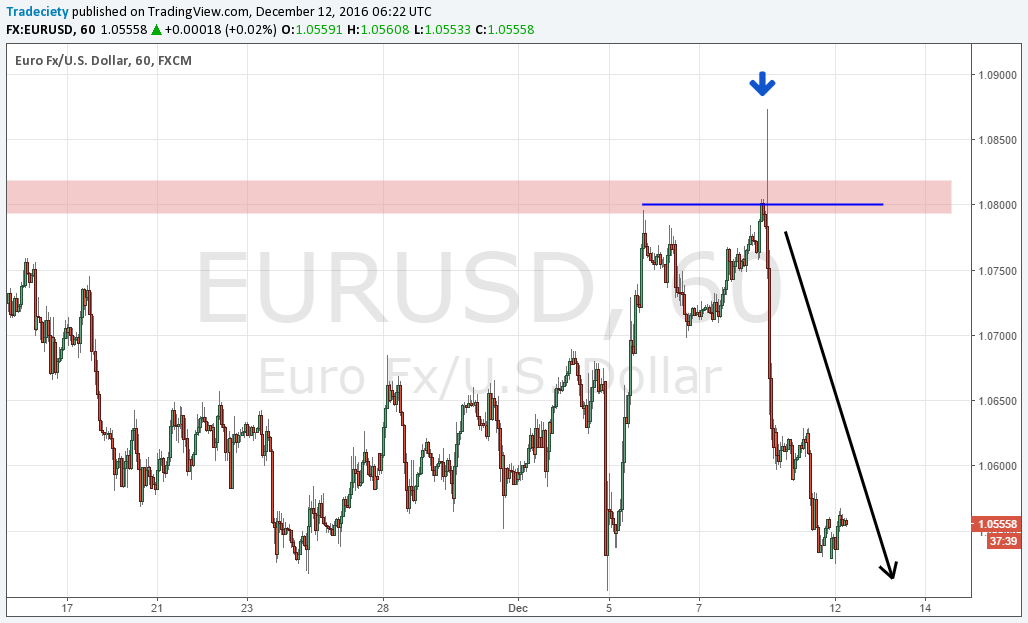
Furthermore, when you trade bear and bull traps, support and resistance is also a very important topic because many traders place their limit stop and target orders around those levels. Traps then aim at taking out those levels and make it look like a breakout for the impatient traders just before the price reverses into the opposite direction.
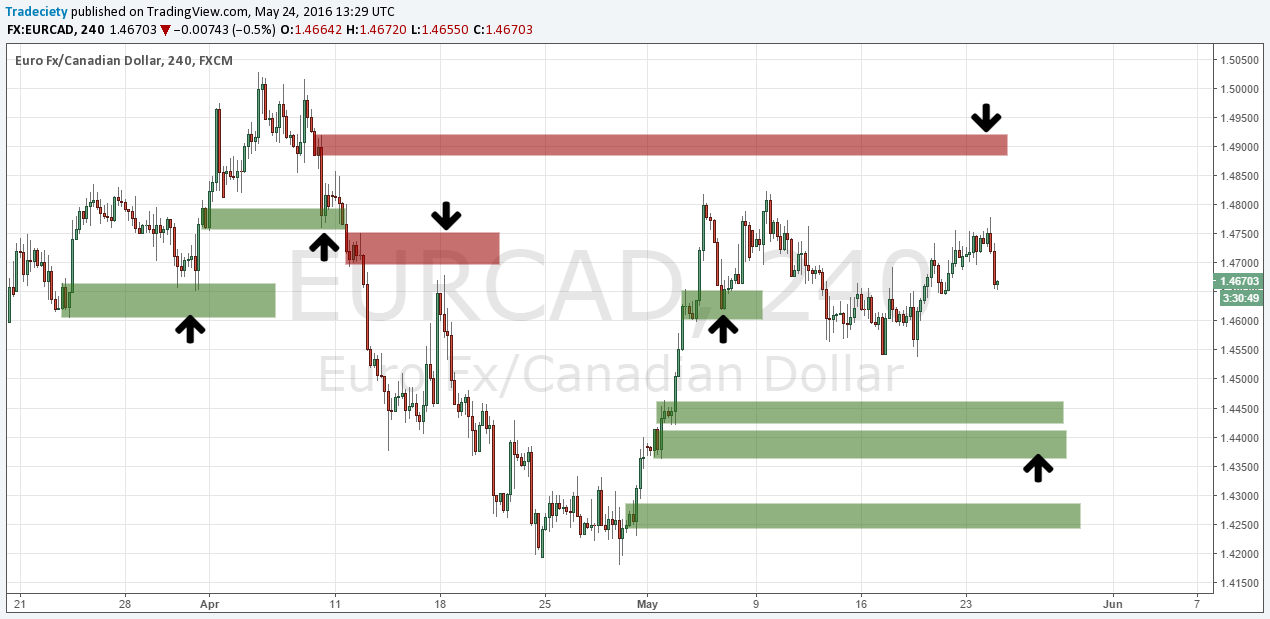
The idea behind supply and demand is that supply and demand areas show the origins of large, impulsive and strong price movements. Those origins are then used to time entries into the same direction once price moves back into those areas and picks up the unfilled orders.
I don’t advise to trade blindly (using pending orders) off supply and demand zones but it is usually better to wait for confirmation and other signals around those areas. Although supply and demand is a great concept, you’ll often see price overshoot the areas slightly or come short of them which highlights the importance of waiting for a confirmed move instead of just trading based on hope.
The five golden rules of supply and demand trading are:
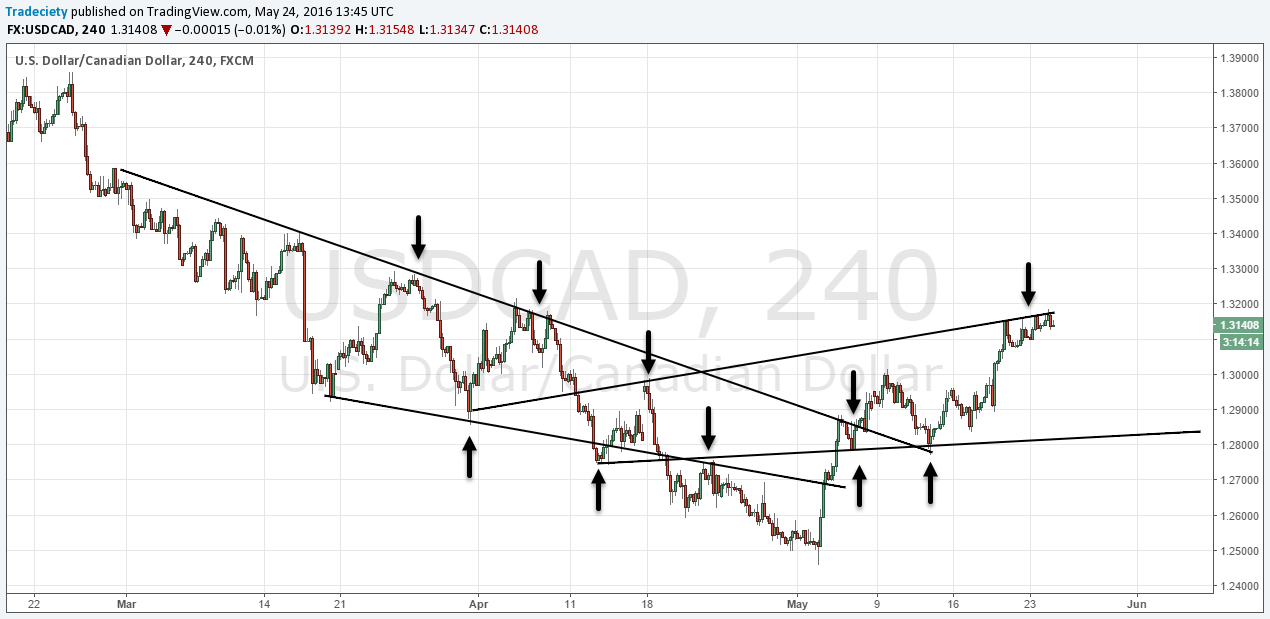
Trendlines and channels are great tools when you are looking for non-horizontal technical analysis tools. Trendlines are especially valuable if you are looking for potential trouble areas during trending markets, when it comes to identifying re-entry opportunities during pullbacks and to look for trend-accelerating points where price breaks a trendline.
When it comes to drawing trendlines, go for the most obvious ones with the most touches. As with support and resistance, you don’t want to end up with dozens of lines but only focus on the major ones that explain price movements the best.
The main signals that trendlines give you are:
Round numbers are very popular in retail trading because many amateur traders use those round numbers in their own trading for stop loss and take profit placement. The screenshot below shows Oanda’s orderbook and it is obvious how orders cluster around the round numbers.
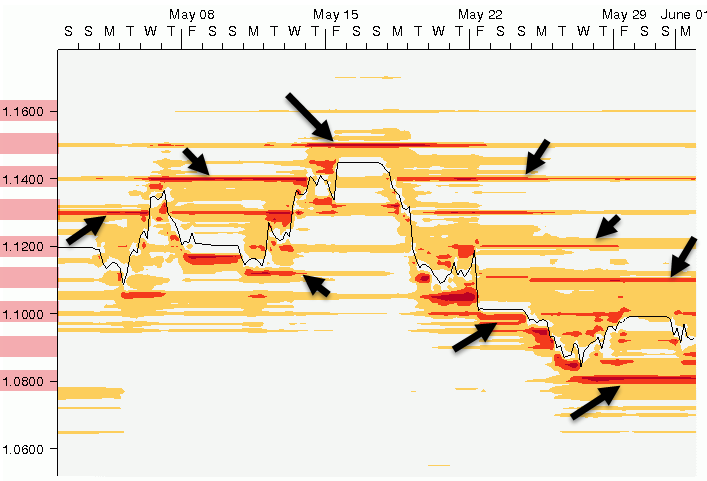
Historical open sell orders – Black arrows indicate order clustering around round numbers- Oanda Order Book
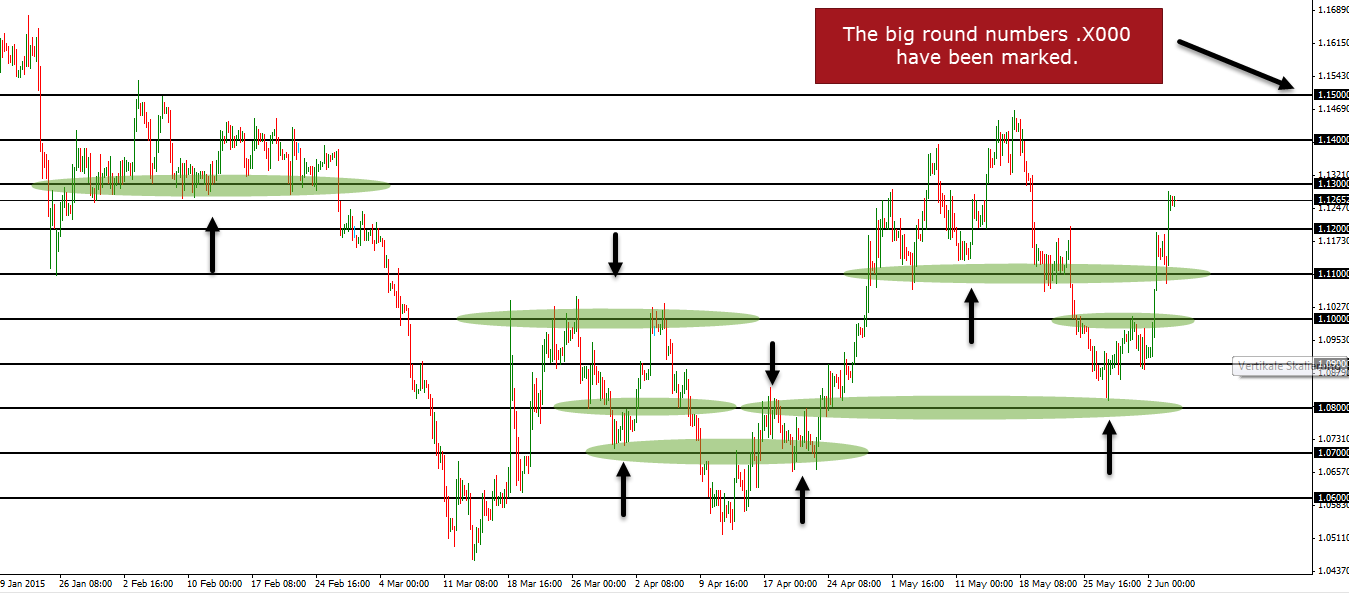
The screenshot below also shows how round numbers often act as natural support and resistance and price often bounces off those price levels. It’s worth having round numbers on your charts, but it’s equally important not to get too hung up on round numbers and worry about each and every round number when you analyze price charts.
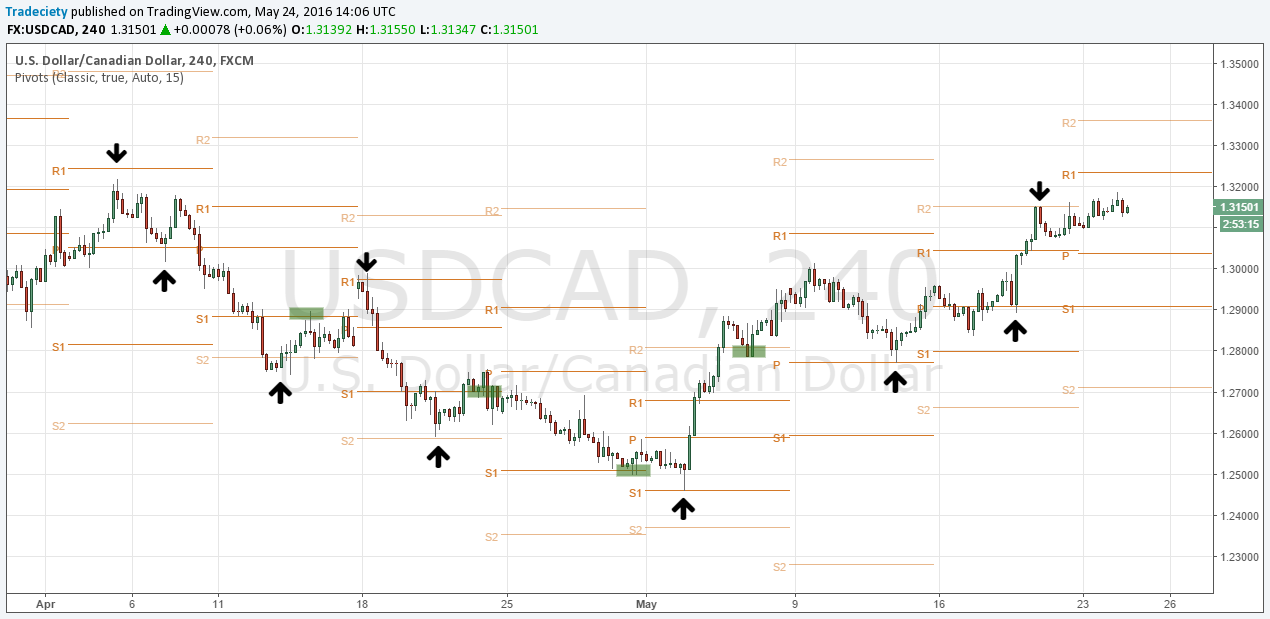
Pivot points were originally created by floor traders who calculated the pivot points at the beginning of each trading day and then used those price levels for support and resistance. Intraday Pivot points are based on yesterday’s high, low and close so they don’t change throughout the day. On other timeframes, pivot points are created based on previous week’s price action and don’t change for a whole week.
When you look at a chart, pivot points are labeled R, R1, R2, R3, S1, S2 and S3.
P: Central pivot point and it’s the mean of yesterday’s price action
S1 – S3: The 3 support pivot points below the central P pivot
R1 – R3: The 3 resistance pivot points above the central P pivot
In your trading, you’d use pivot points like regular support and resistance for your target placement and also for entering trades when you see that the pivots hold and cause new momentum movements.
Another rule of thumb is that price moves often extend from S to R. For example, a move that started at S1 will often go to R1, a move that started at R2 will often go to S2. Of course, there is more to that but such an approach can add more objectivity to your trading and trade management.
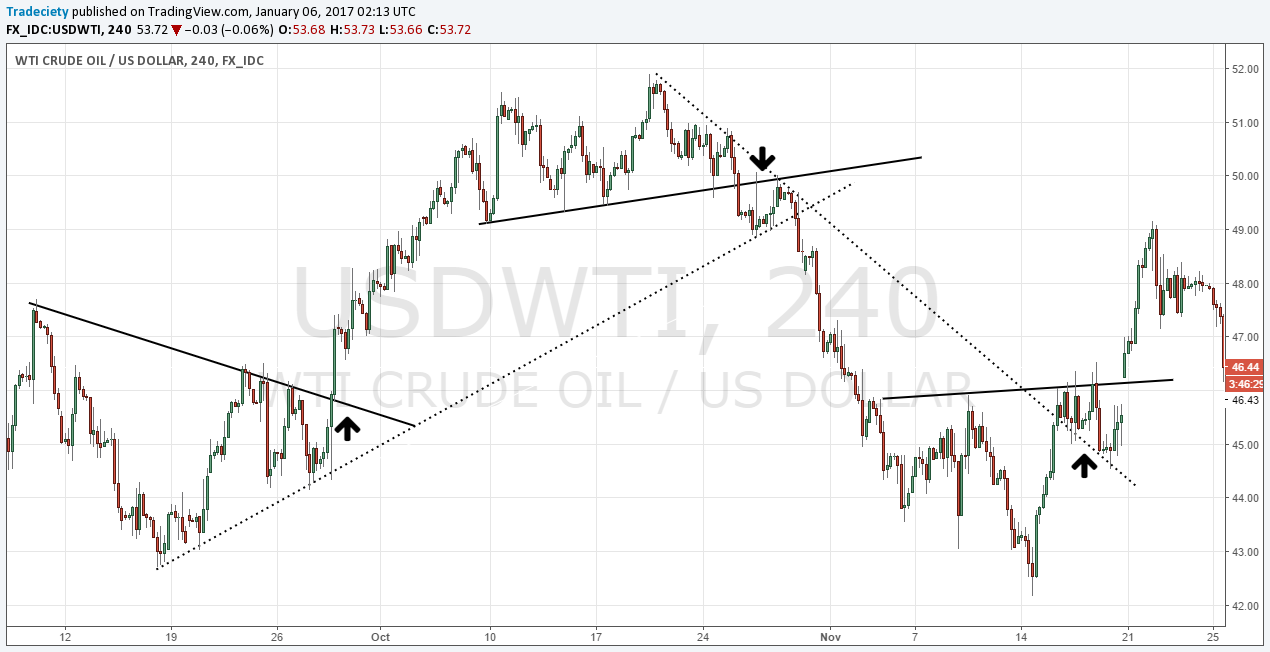
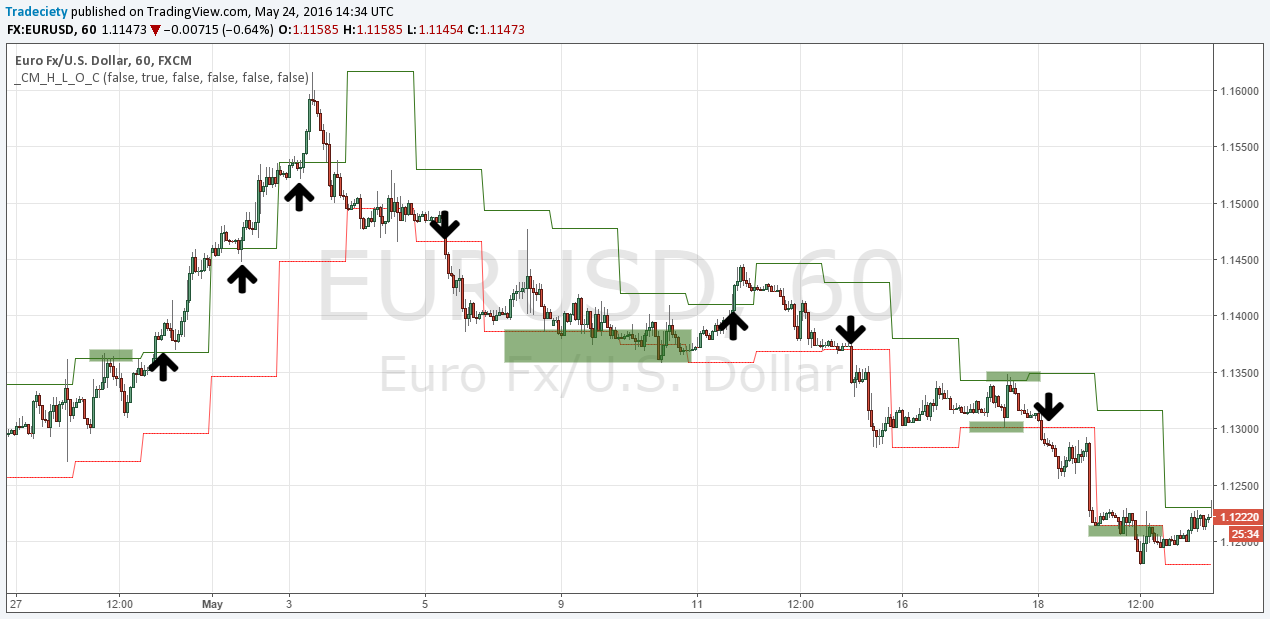
Similarly to pivot points, many traders look at previous days’ highs and lows in their trading. A break of a previous’ day high can often lead to accelerated buying and create new trends as many traders watch those price levels and/or have their pending orders sitting there.
The chart below shows that nicely and the green and red channel show previous’ days highs and lows. Those levels don’t only act as support and resistance, but when they are broken with momentum, price often starts new trends.
It’s not about which concept you choose and no single concept is better or worse than the other. In trading, the most important factor is that you make CONSISTENT decisions and don’t change from one way of looking at a chart to another. Furthermore, the concepts you use must make sense to you.
So whether you use support/resistance, supply/demand, pivot points or daily highs and lows, make sure that you stick to one single approach and avoid making quick changes.
No concept will work all the time and it’s not necessary that you have a 100% winrate. But, the more consistent your trading decisions, the better your trading will be. So stop looking for ‘the next best thing’ and choose your trading tools once and for all.


external link:
external link:

3 min read
The following is a guest post from Michael Lamothe.
I'm Michael Lamothe, and today marks an extraordinary milestone: the first anniversary of "The...
3 min read
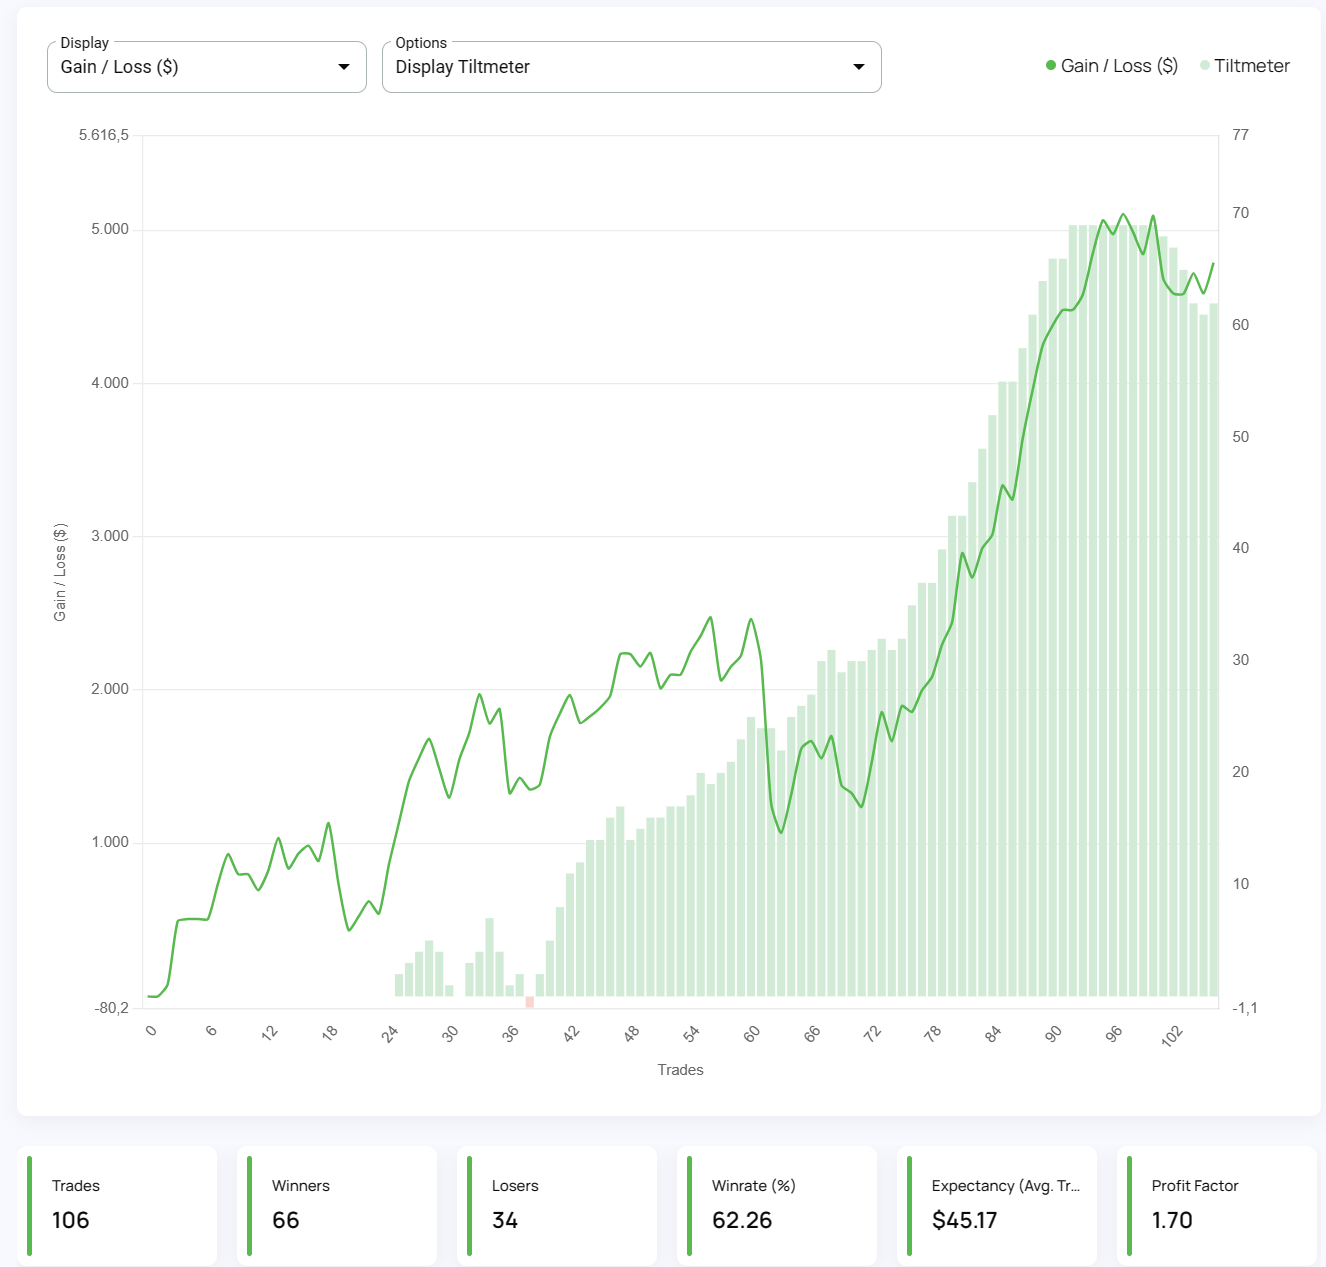
It's easy to get discouraged by losses and question your every move. But what if there was a way to track your progress, learn from mistakes, and...

8 min read
Dive deep into the world of finance and high-stakes trading with this selection of movies and documentaries! From the exhilarating thrill of...