3 min read
A Year with "The Trading Mindwheel": Transforming Trading Through Psychology
The following is a guest post from Michael Lamothe.
I'm Michael Lamothe, and today marks an extraordinary milestone: the first anniversary of "The...
How many of you think that it is just a matter of finding the right trading strategy so that you can finally start making all the money you believe is out there waiting for you? What if we told you that having a trading strategy is not enough, but that you constantly have to adapt to changing market conditions and change your trading behavior from trade to trade? Most traders will not be happy to hear such claims because it means that they have to work much harder and change their whole approach. On the other hand, if you do not adapt to constantly changing market conditions, you will never be able to make money in trading. In the following article we show you exactly what it means for your trading when markets are changing and how you have to adapt to it with your trading strategy.
To be clear, there are multiple ways when it comes to dealing with changing and evolving markets. In the following we just share one possibility how you can adapt to different market conditions.
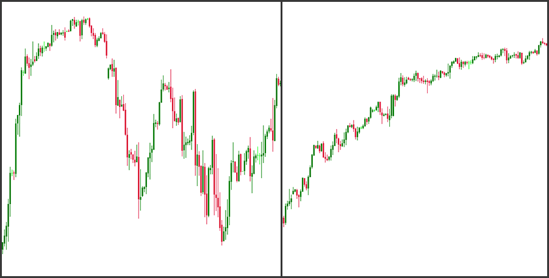
Volatility is the factor that constantly changes and when volatility changes, your trading strategy has to change too. Let’s take a look at the two charts below. They both show the same instrument with only a three months difference. Whereas the right chart shows a very smoothly moving market, candles that have roughly the same size, without significant outliers, the left chart shows a chart with large candles, whipsawing and constant changes of direction. Now if you still think that you can take one trading method and apply it across the board to any market condition, you will not last long as a trader.

|
Traders usually complain when volatility is low and when it picks up, they get excited again. However, when volatility is high, most traders get burned significantly and under-perform. Studies show that traders who invest in stocks with high volatility have an under-performance of 5%, compared to 1.5% when trading low volatility stocks. Let’s explore what you have to change when you are trading in a high volatility environment and what it means for a trader.
|
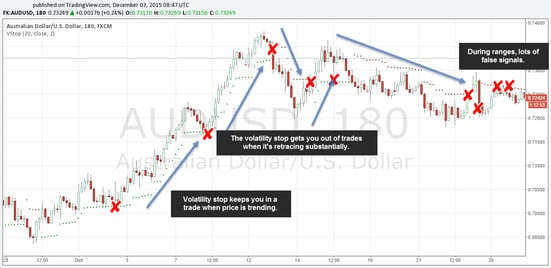
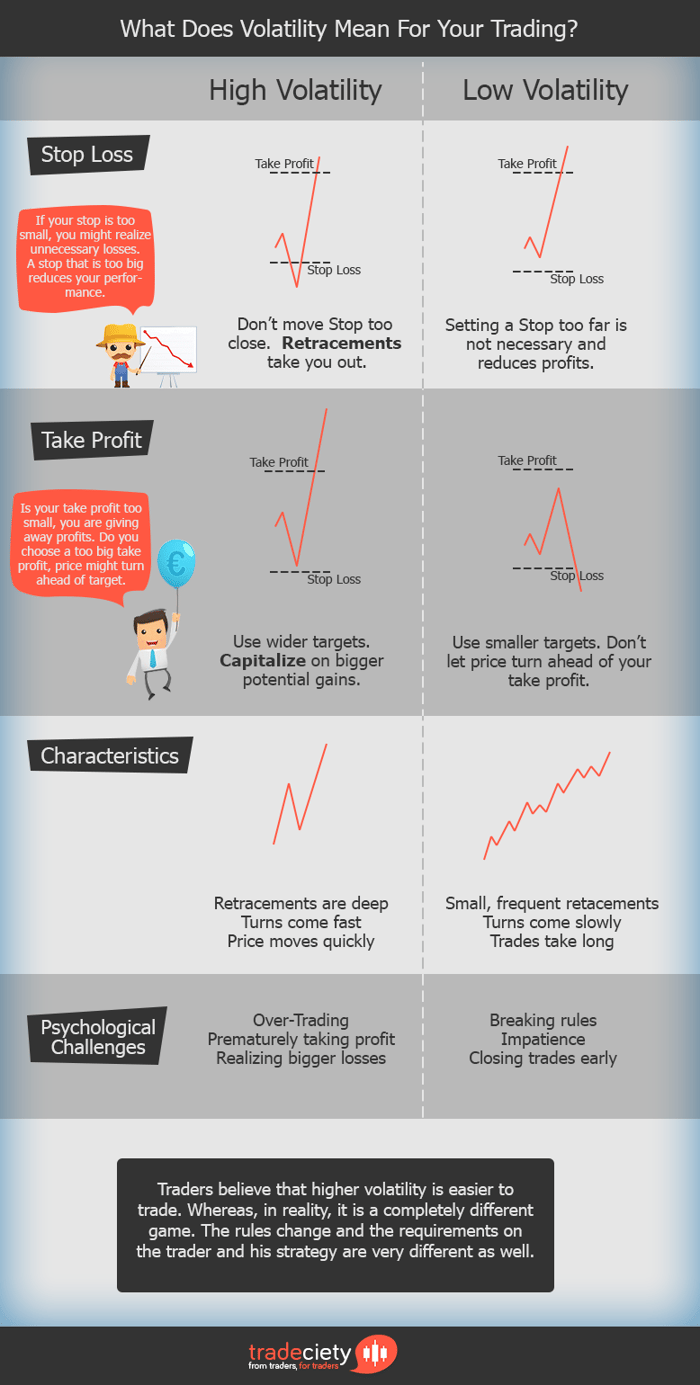
When volatility is high, prices move fast. A trader has to make quick decisions that can cost him a lot of money, or make him a lot of money in a short time. Retracements can happen at any time during the trade and with high volatility they can be significant; but they can be over just as fast and price will move back in the original direction. On the other hand, reversals happen just as quickly and do not leave much time to think for a trader when to get out.
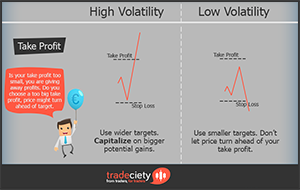
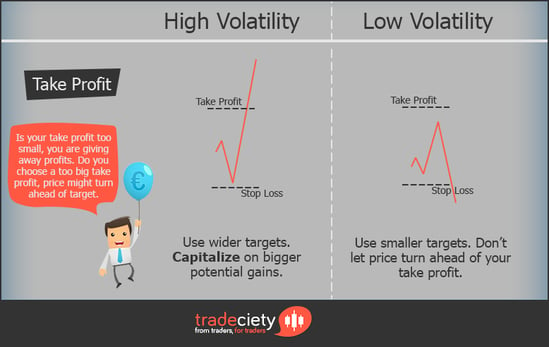
Your stop loss should be set wider when volatility is high. The reason is that when prices move further, they can easily overshoot your entry, go straight to your stop loss before heading for your original take profit. You don’t want to see that your trade idea was right, but a price spike took you out before you could make money. However, you can only set your stop loss orders wider, when you also adjust your take profit placement, or you are ruining your expected return.
When widening stop loss orders, you have to adjust your take profit orders as well to make up for the potentially larger losses. When volatility is high you, therefore, have to set your take profit orders further away as well. When markets are volatile you have to use bigger take profit orders to capture the volatile moves and realize bigger profits. You are giving away money if you do not adjust your take profit placement and don’t capitalize on high volatility.

High volatility brings a variety of psychological and emotional challenges for traders. The biggest and most dangerous is that volatility leads to over-trading. The reason is that when markets are moving fast, you might get entry signals more often; additionally, the temptation to jump in and make a quick buck when things are moving fast is higher as well. The second challenge is dealing with your greed and fear responses. Fearful traders will not be able to fully capitalize on high volatility and cut their winners short, significantly reducing the return of their trading. Greedy traders, on the other hand, try to get even more money by widening their take profit orders too much and risk giving it all back when markets suddenly turn.
Low volatility requires a completely different approach to maximize gains, while eliminating potential problems that a low volatility environment brings.
The retracements are much smaller, but more frequent when volatility is low. Furthermore, a trade takes much longer to unfold and the trading signals a trader receives come less frequently. All these things seem to be of small concern, but when we get to the psychological challenges in a bit, you will see that the impacts on your trading can be quite significant.
When volatility is low, prices don’t move as much and, therefore, a trader should set his stop loss orders a little closer to his entry. There is usually no need to use a wide stop loss order in a market where volatility is low, unless your method of timing entries is way off. Price does not move as much and using a wide stop loss is only reducing your expected return when volatility is low.
Just as you have to use smaller stop loss orders, your take profit orders need to be closer to your entry as well. The reason is simple; when volatility is low, prices don’t move as much and if you do not adjust your take profit placement, price won’t make it to your take profit order and turn ahead, although your original trade idea was right. Therefore, by using both, smaller take profit and stop loss orders, you account for a smaller average price range, while keeping your risk reward ratio relatively constant.
Low volatility also brings several different psychological difficulties for traders. First, due to slower markets and fewer trade signals, a trader can get bored quite easily and be tempted to abort his trading rules and jump into the market prematurely. Furthermore, if you see a lot of small back and forth during your trade, you have a higher chance of making premature decisions and cutting your winners short, although they would have made it to your target eventually.
Now that we know the impact changes in volatility can have and what you have to do when volatility changes, we have to take a look at how to track volatility. There are numerous ways of doing it and we provide three different methods so that you can pick the ones you are most comfortable with.
We can stick to our first chart and put them side by side. You don’t have to be a professional market analyst to see the differences in candle size. Although using candle size alone might seem a little bit too superficial, it can give you a fairly accurate first indication of what the current state is. The charts below illustrate that by just looking at the candle, their size and the development over time, you can get a very good idea of how different volatility can be.
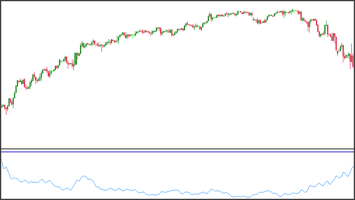
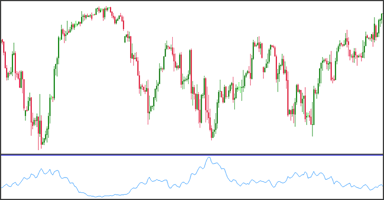
The ATR indicator calculates the average price range markets have moved over a specific period. A high ATR, therefore, signals that prices moved a significant amount in the period the ATR is set to. In contrast, a low ATR signals that volatility is low. When volatility is high, you can also see more overall fluctuations on the ATR itself, showing that markets are changing constantly and rapidly. The ATR indicator can be a helpful tool when you want to assign a specific value to a volatility measurement.
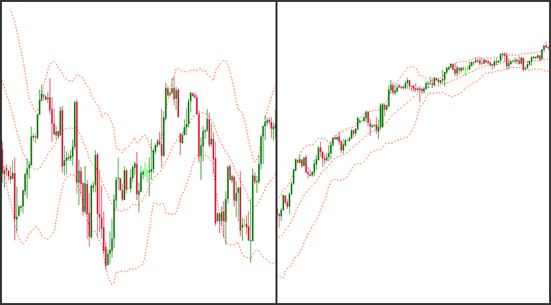
Bollinger Bands are another famous tool among technical traders to analyze the volatility of a specific instrument. The left image shows the Bollinger Bands in a high volatility environment, the right one shows lower volatility. To read the Bollinger Bands you have to analyze the width of the bands themselves. When the outer bands are close together, volatility is low, since the bands are being calculated by taking the standard deviation over a specific period. When you look at the left chart, where volatility is high, you can see that the bands are far apart, indicating a high standard deviation and high volatility. The right chart, on the other hand shows a low volatility time with Bollinger Bands close together.
Markets are dynamic, but most trading strategies are static and do not adjust to changing markets. By analyzing volatility and adjusting your trading approach accordingly you can take your trading to a whole new level. As a trader, you have to know what to change, when to change it and why. Then you can succeed. No trading strategy will work 100% of the time, but it’s a trader’s responsibility to find ways to make his trading strategy work in all market conditions.

external link:
external link:

3 min read
The following is a guest post from Michael Lamothe.
I'm Michael Lamothe, and today marks an extraordinary milestone: the first anniversary of "The...
3 min read
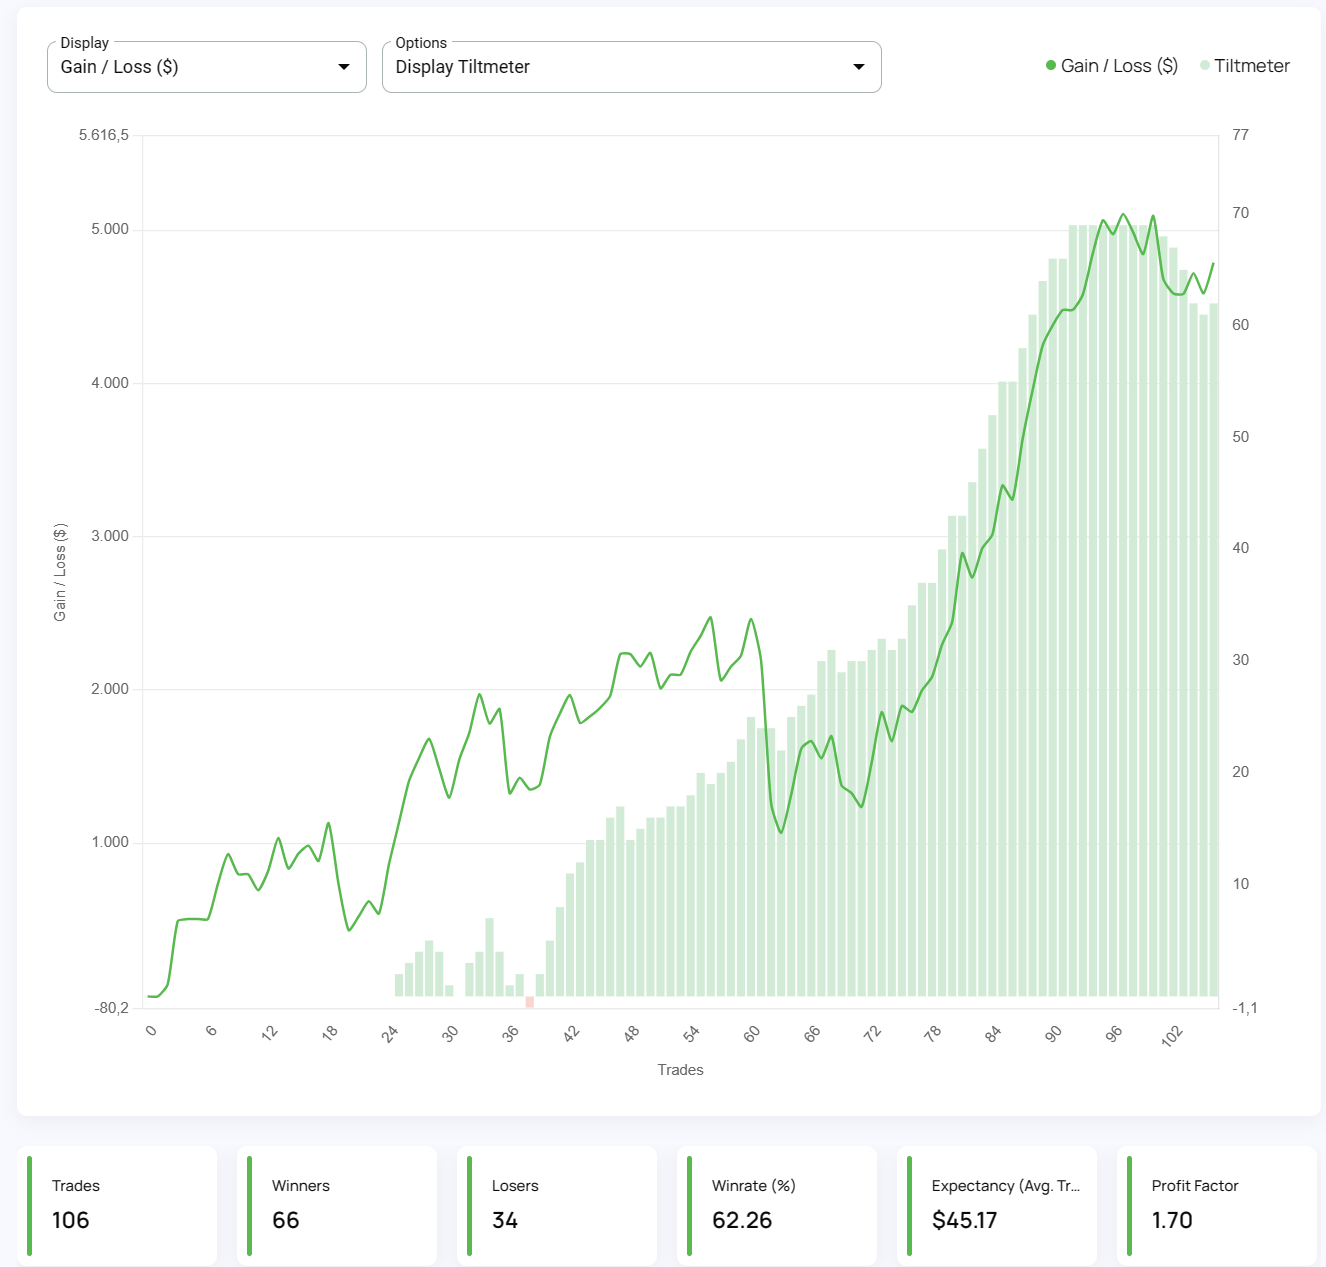
It's easy to get discouraged by losses and question your every move. But what if there was a way to track your progress, learn from mistakes, and...

8 min read
Dive deep into the world of finance and high-stakes trading with this selection of movies and documentaries! From the exhilarating thrill of...