3 min read
A Year with "The Trading Mindwheel": Transforming Trading Through Psychology
The following is a guest post from Michael Lamothe.
I'm Michael Lamothe, and today marks an extraordinary milestone: the first anniversary of "The...

In the previous installment on the series on Bill Williams’ Chaos Theory and Alligator Trading System, we discussed how to use the moving average-based Alligator indicator in conjunction with the famous Fractals indicator. Today, we will try to give a brief overview of the other Wiseman Indicators like Awesome Oscillator and Acceleration / Deceleration Oscillator (AC)used by the Alligator Trading System and how to scale in and scale out of the market this highly profitable system.
If you have not read the previous article covering the Alligator and Fractals, it would be wise to read it first and understand why the Fractal indicator is considered the first dimension in the Chaos Theory. After all, unless we see the price breaking above an Up Fractal or breaking below a Down Fractal, we cannot consider any other Wiseman Indicators to take a trading decision.
The core of any technical analysis-based trading system is the concept of extrapolation. In finance, extrapolation means an estimation of future value based on extending a previously known sequence of values.
Extrapolation is a cornerstone of behavioral finance. However, keep in mind that proponents of Efficient Market Hypothesis (EMH) like Nobel laureate Eugene Fama believe it is not possible to earn an extraordinary return on investment from such forecasting methods.
Nonetheless, when we use the Alligator indicator, we are extrapolating that that the market will continue to trade in the direction of the Alligator’s signal, either up or down. There is a reason why any directional movement tends to create a ripple effect in the market because once a major support or resistance level is broken. Then, it triggers a series of pending orders that creates the illusion of momentum in the market.
Now, Bill Williams and his team knew full well that if we can measure the strength of this momentum, it can help us enter the market when momentum is increasing, and we can safely get out when the existing momentum fades away.
The Awesome Oscillator (AO) can provide us with a good proxy of the momentum in the market.
In essence, Awesome Oscillator (AO) simply measures the difference between the 5-period and 34-period simple moving average. It does so by calculating the bar’s midpoints (H+L)/2.
There are three types of BUY and SELL signals generated by the Awesome Oscillator.
Awesome Oscillator – Zero Line Crossover BUY and SELL signals
After the first dimension, price breaking above or below Fractals, the Alligator Trading System usually generates the next signal in terms of Awesome Oscillator Zero Line Crossover. When the Awesome Oscillator bar crosses above the Zero line, it produces a BUY signal. By contrast, when we see the Awesome Oscillator crossing below the Zero line, it can be taken as a SELL signal.
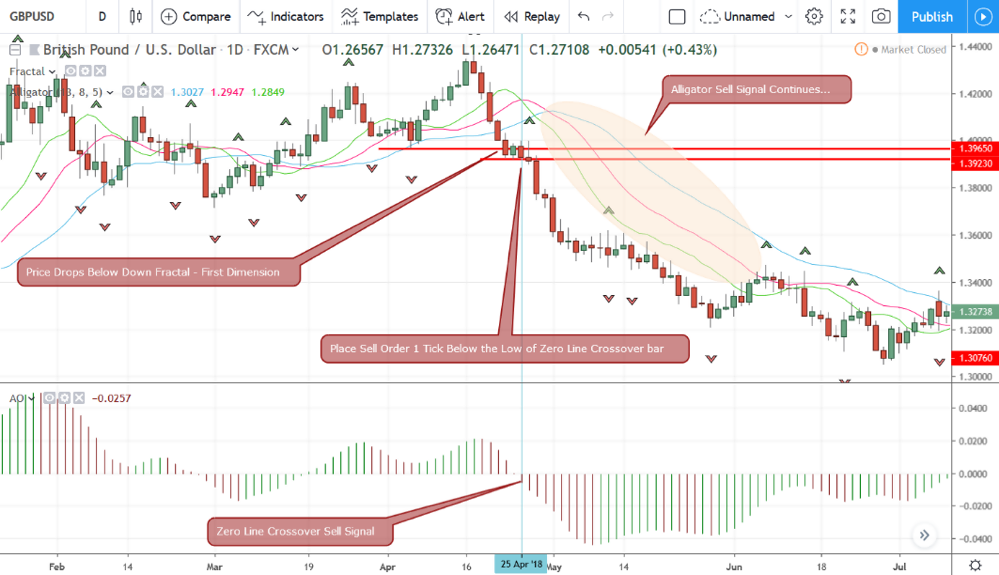
Figure 1: Awesome Oscillator Zero Line Crossover Sell Signal
In figure 1, you would probably already in the market with an open sell order as the Alligator signaled sell and the price broke below the last Down Fractal. Now, according to the Alligator Trading System, once you see the Awesome Oscillator crossing below the zero line, it offers an excellent opportunity to increase your exposure in the direction of the prevailing trend.
On April 25, 2018, the Awesome Oscillator on the daily timeframe of GBP/USD crossed below the zero line. So, you can increase your exposure to the existing short position by placing a Sell Stop order just one tick below the low of the bar that crossed below the zero line.
On this occasion, the low was at 1.3920, so the Sell Stop order would have been placed at 1.3919.
Awesome Oscillator – Saucer BUY and SELL signals
When an uptrend or downtrend is in progress, look for the Awesome Oscillator to be above or below the zero line, respectively. If we see the Awesome Oscillator going against the prevailing trend, then we can expect to see a Saucer signal, which is basically two consecutive red bars during an uptrend followed by a green bar or two consecutive green bars followed by a red bar during a downturn will signal that the prevailing trend is about to resume.
As you can imagine, such market condition would be perfect for scaling into your existing position.
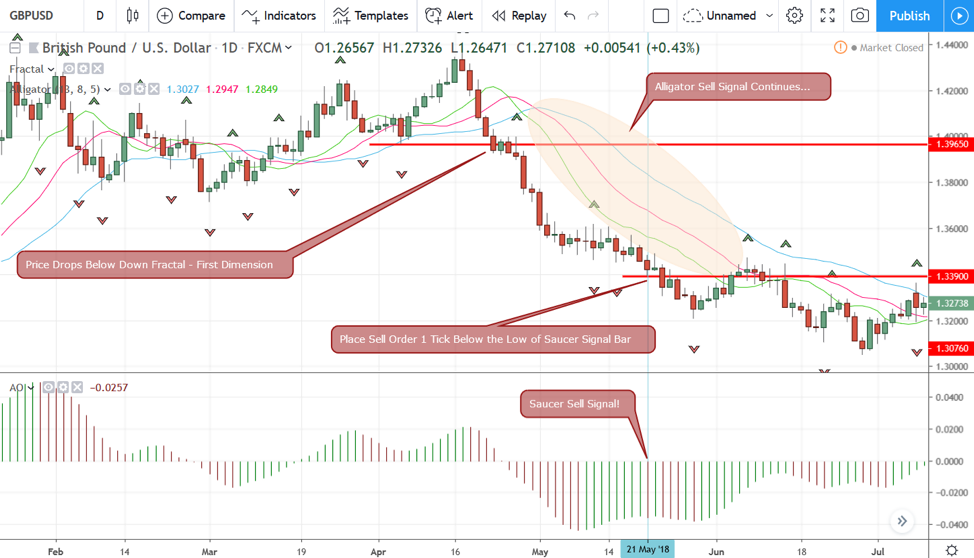
Figure 2: Awesome Oscillator Saucer Sell Signal
In Figure 2, we can see that the Alligator indicator is clearly showing a downturn and the first dimension, Fractals, has broken. Next, the Awesome Oscillator turned Green for almost a week, and the market stayed range-bound. However, on May 21, 2018, the Awesome Oscillator formed a Red bar, producing a Saucer SELL signal.
The way to play this signal is simply placing a Sell Stop order one tick below the low of the bar that produced the Saucer signal. Here, the low of the bar was at 1.3390. So, we would simply place a Sell Stop order at 1.3389.
If you see a Saucer BUY signal during an uptrend, you need to place a Buy Stop order a tick above the high of the bar that produced the Saucer signal. Simple, right?
Awesome Oscillator – Twin Peaks Divergence Signals
The last type of signal generated by the Awesome Oscillator is basically a divergence signal that is called a Twin Peaks signal. The Twin Peaks divergence signal can be interpreted like any other divergence signal produced by major oscillating indicators such as MACD or RSI.
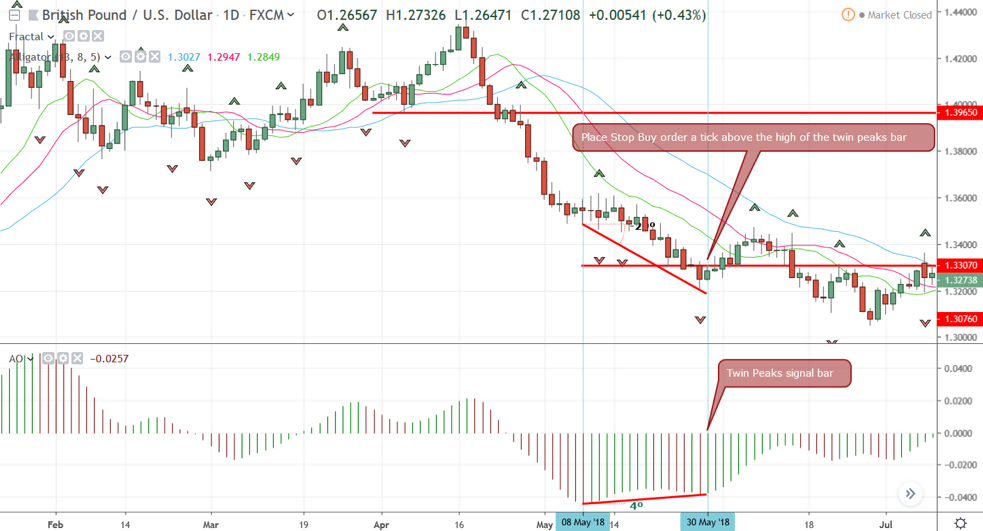
Figure 3: Awesome Oscillator Twin Peaks Divergence Trend Reversal Signal
In figure 3, we can see that downtrend is pretty much established. However, as the price of GBP/USD continues to plummet, the Awesome Oscillator did not follow the price action, but it was gradually going up.
On May 8, 2018, the Awesome Oscillator formed the lowest peak. Later, on May 30, 2018, the Awesome Oscillator formed the second peak, then produced a higher Green bar. This constituted the Twin Peaks divergence as the Awesome Oscillator formed a 4-degree uptrend, but the price action of GBP/USD formed a minus 29-degree downtrend.
At this point, you would usually move all the Stop Loss of your Sell orders a tick above the Twin Peaks divergence bar, which is at 1.3307. So, the Stop Losses of all open Sell orders should be placed at 1.3308.
If you are not a conservative or risk-averse trader, you can also place a Buy Stop order at 1.3308 to get in early in a potential reversal. However, according to the Alligator Trading System, you should wait for the price to break above an Up Fractal on the other side of the Alligator’s teeth (red line) first.


external link:
external link:

3 min read
The following is a guest post from Michael Lamothe.
I'm Michael Lamothe, and today marks an extraordinary milestone: the first anniversary of "The...
3 min read
It's easy to get discouraged by losses and question your every move. But what if there was a way to track your progress, learn from mistakes, and...

8 min read
Dive deep into the world of finance and high-stakes trading with this selection of movies and documentaries! From the exhilarating thrill of...