Supply and Demand Trading in 2026
We have been trading supply and demand strategies for over ten years, and they have stood the test of time remarkably well. Supply and demand is...
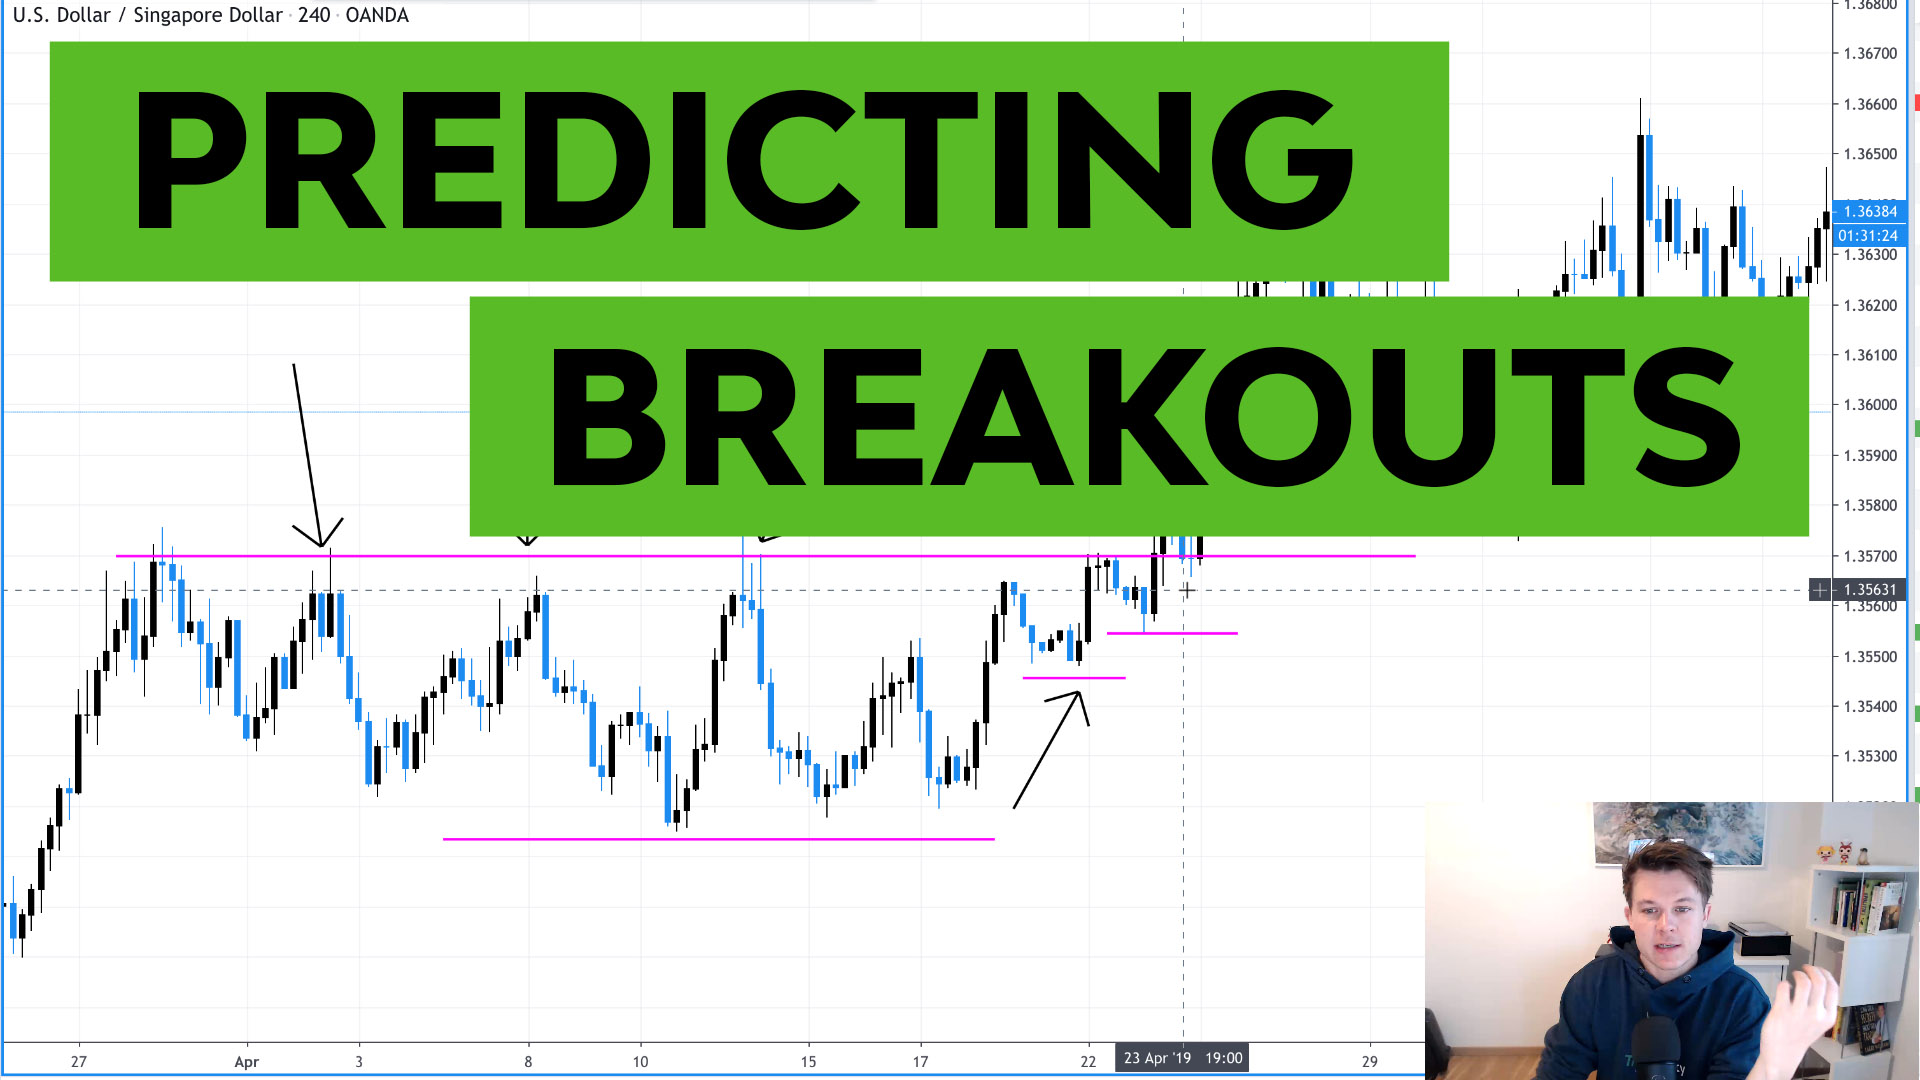
Can we really predict breakouts? Well, kind of. Although we will never know what is going to happen BEFORE it will happen, there are certain clues that will help us identify high-probability potential breakouts.
In my trading, I call this pattern the “lower bounce” and although it seems like such small detail, it can improve your chart reading significantly. This pattern also builds the foundation for many of the setups that I trade.
You should always ask yourself this question from now on. How the price trades into a specific support or resistance level can actually tell you a lot about what is going on behind the scenes. It will help us understand if the buyers or the sellers are gaining strength and where the market is likely to go next.
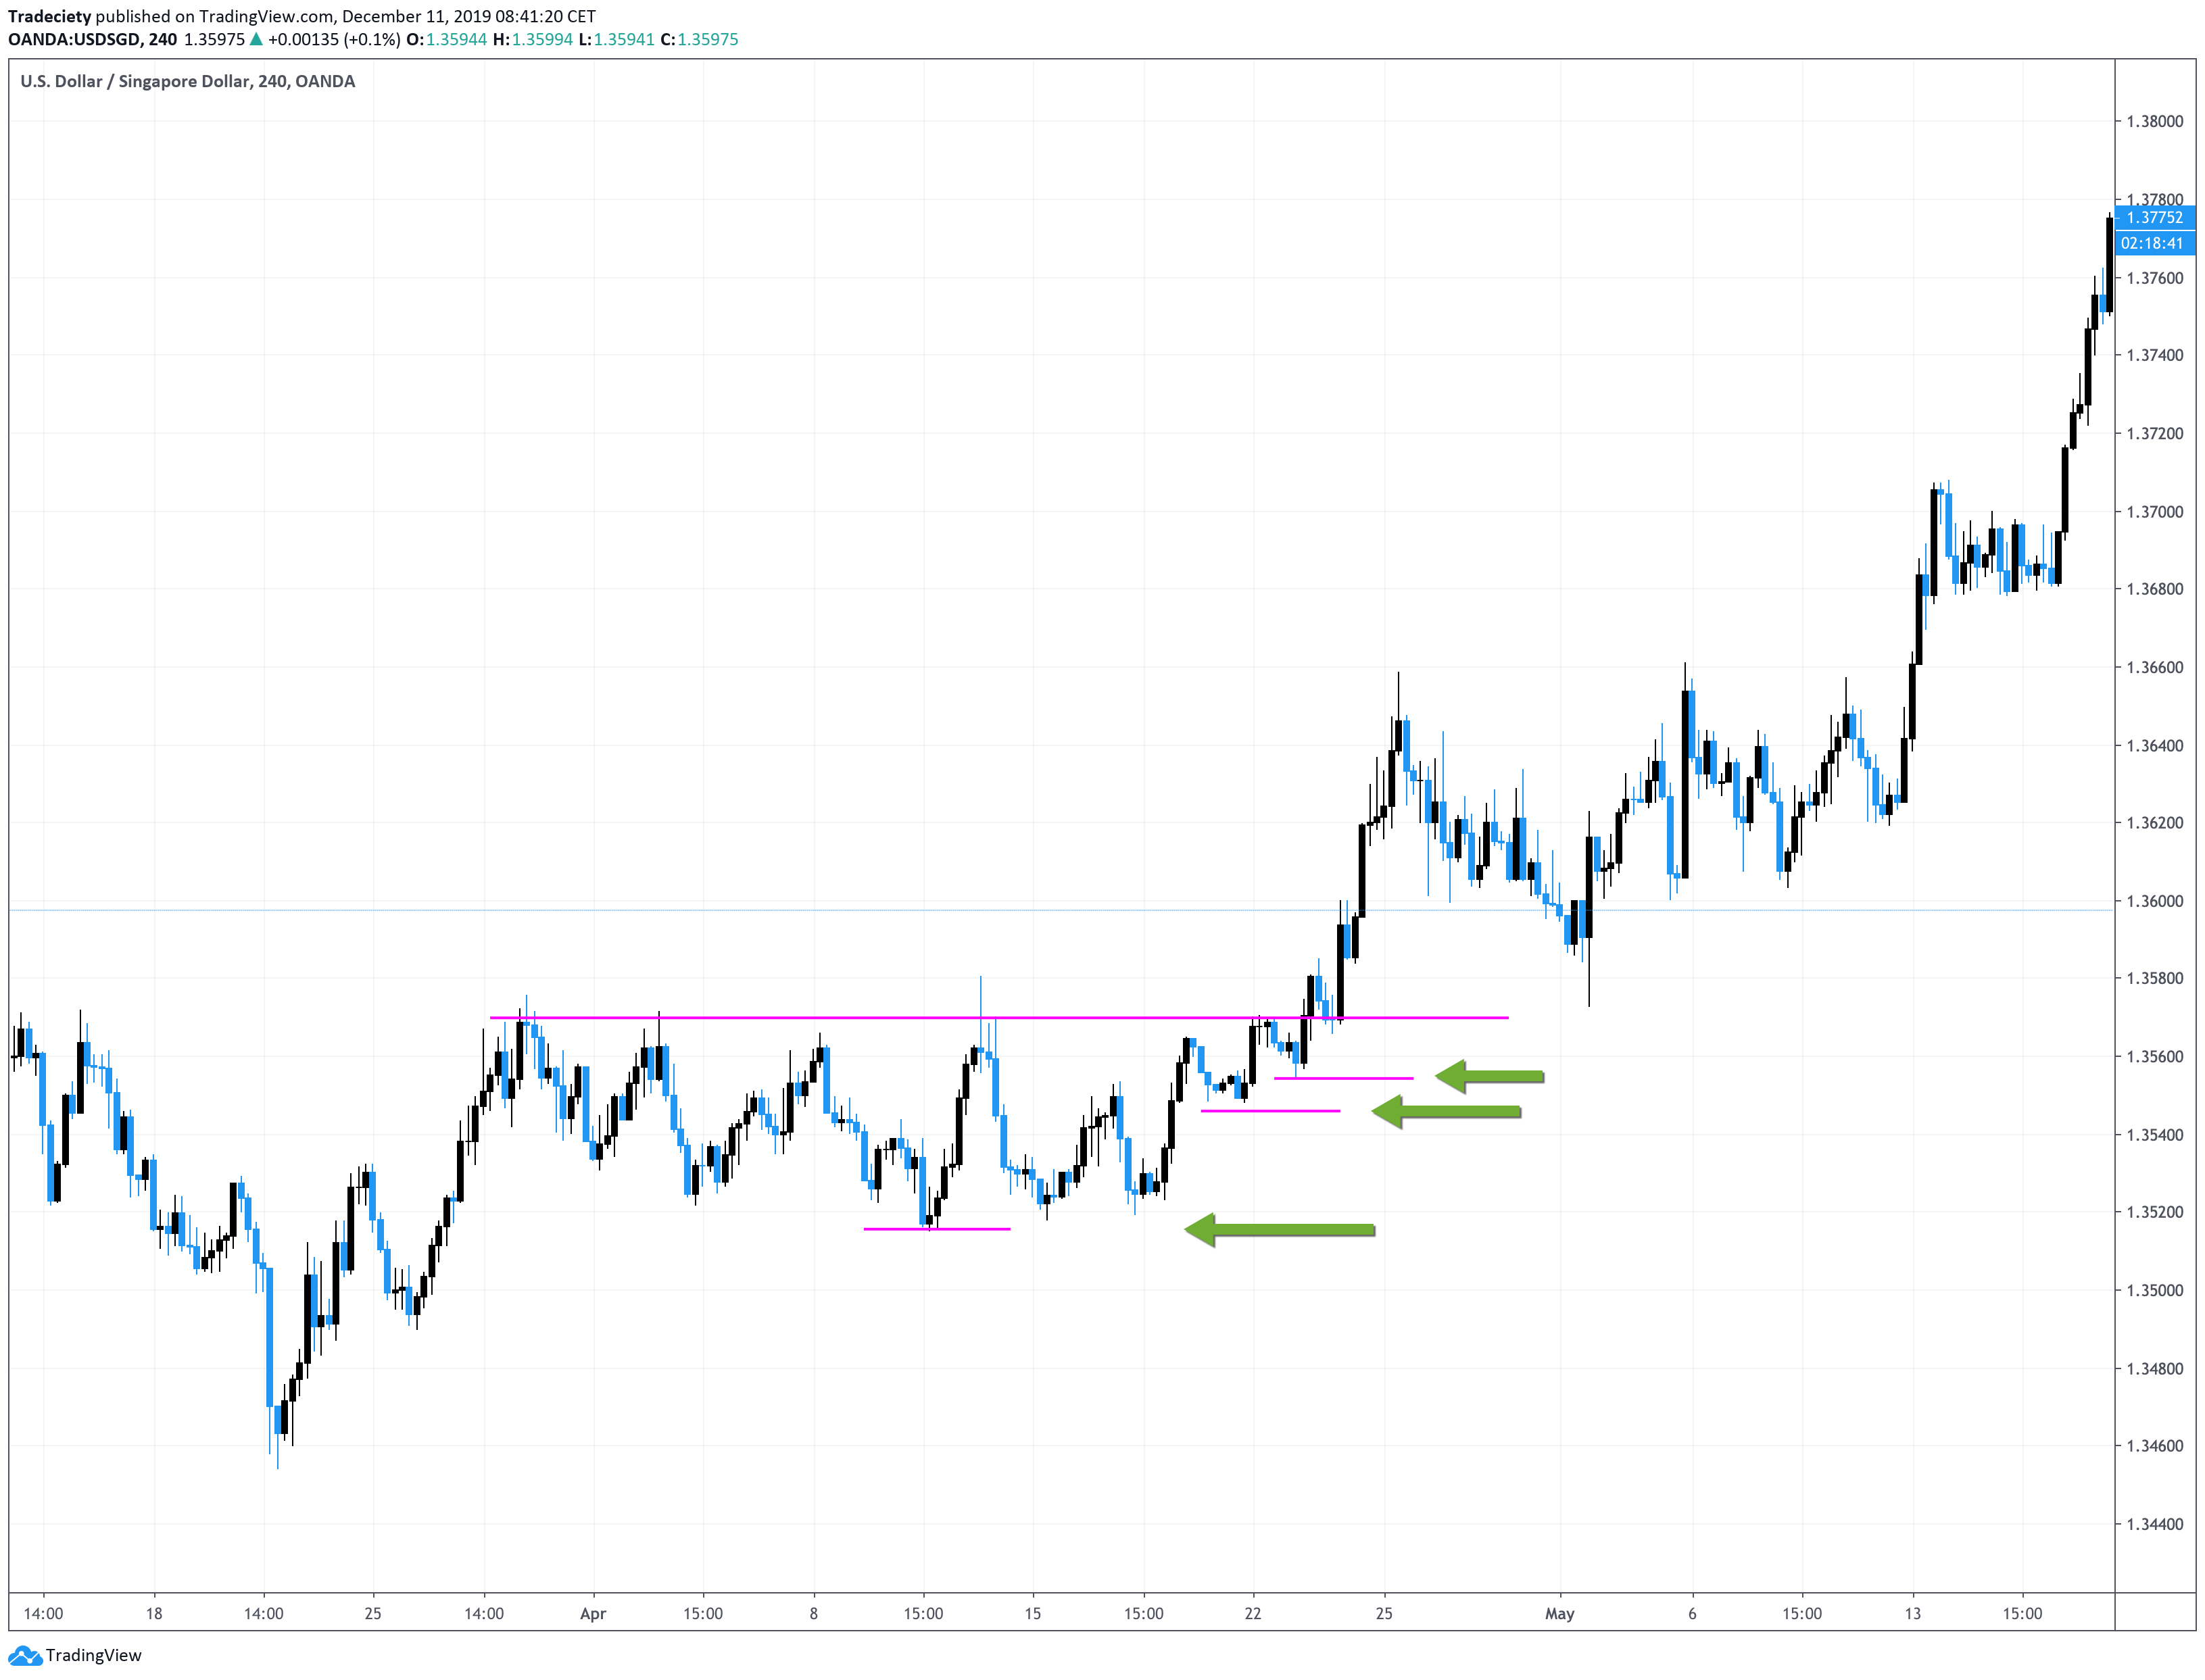
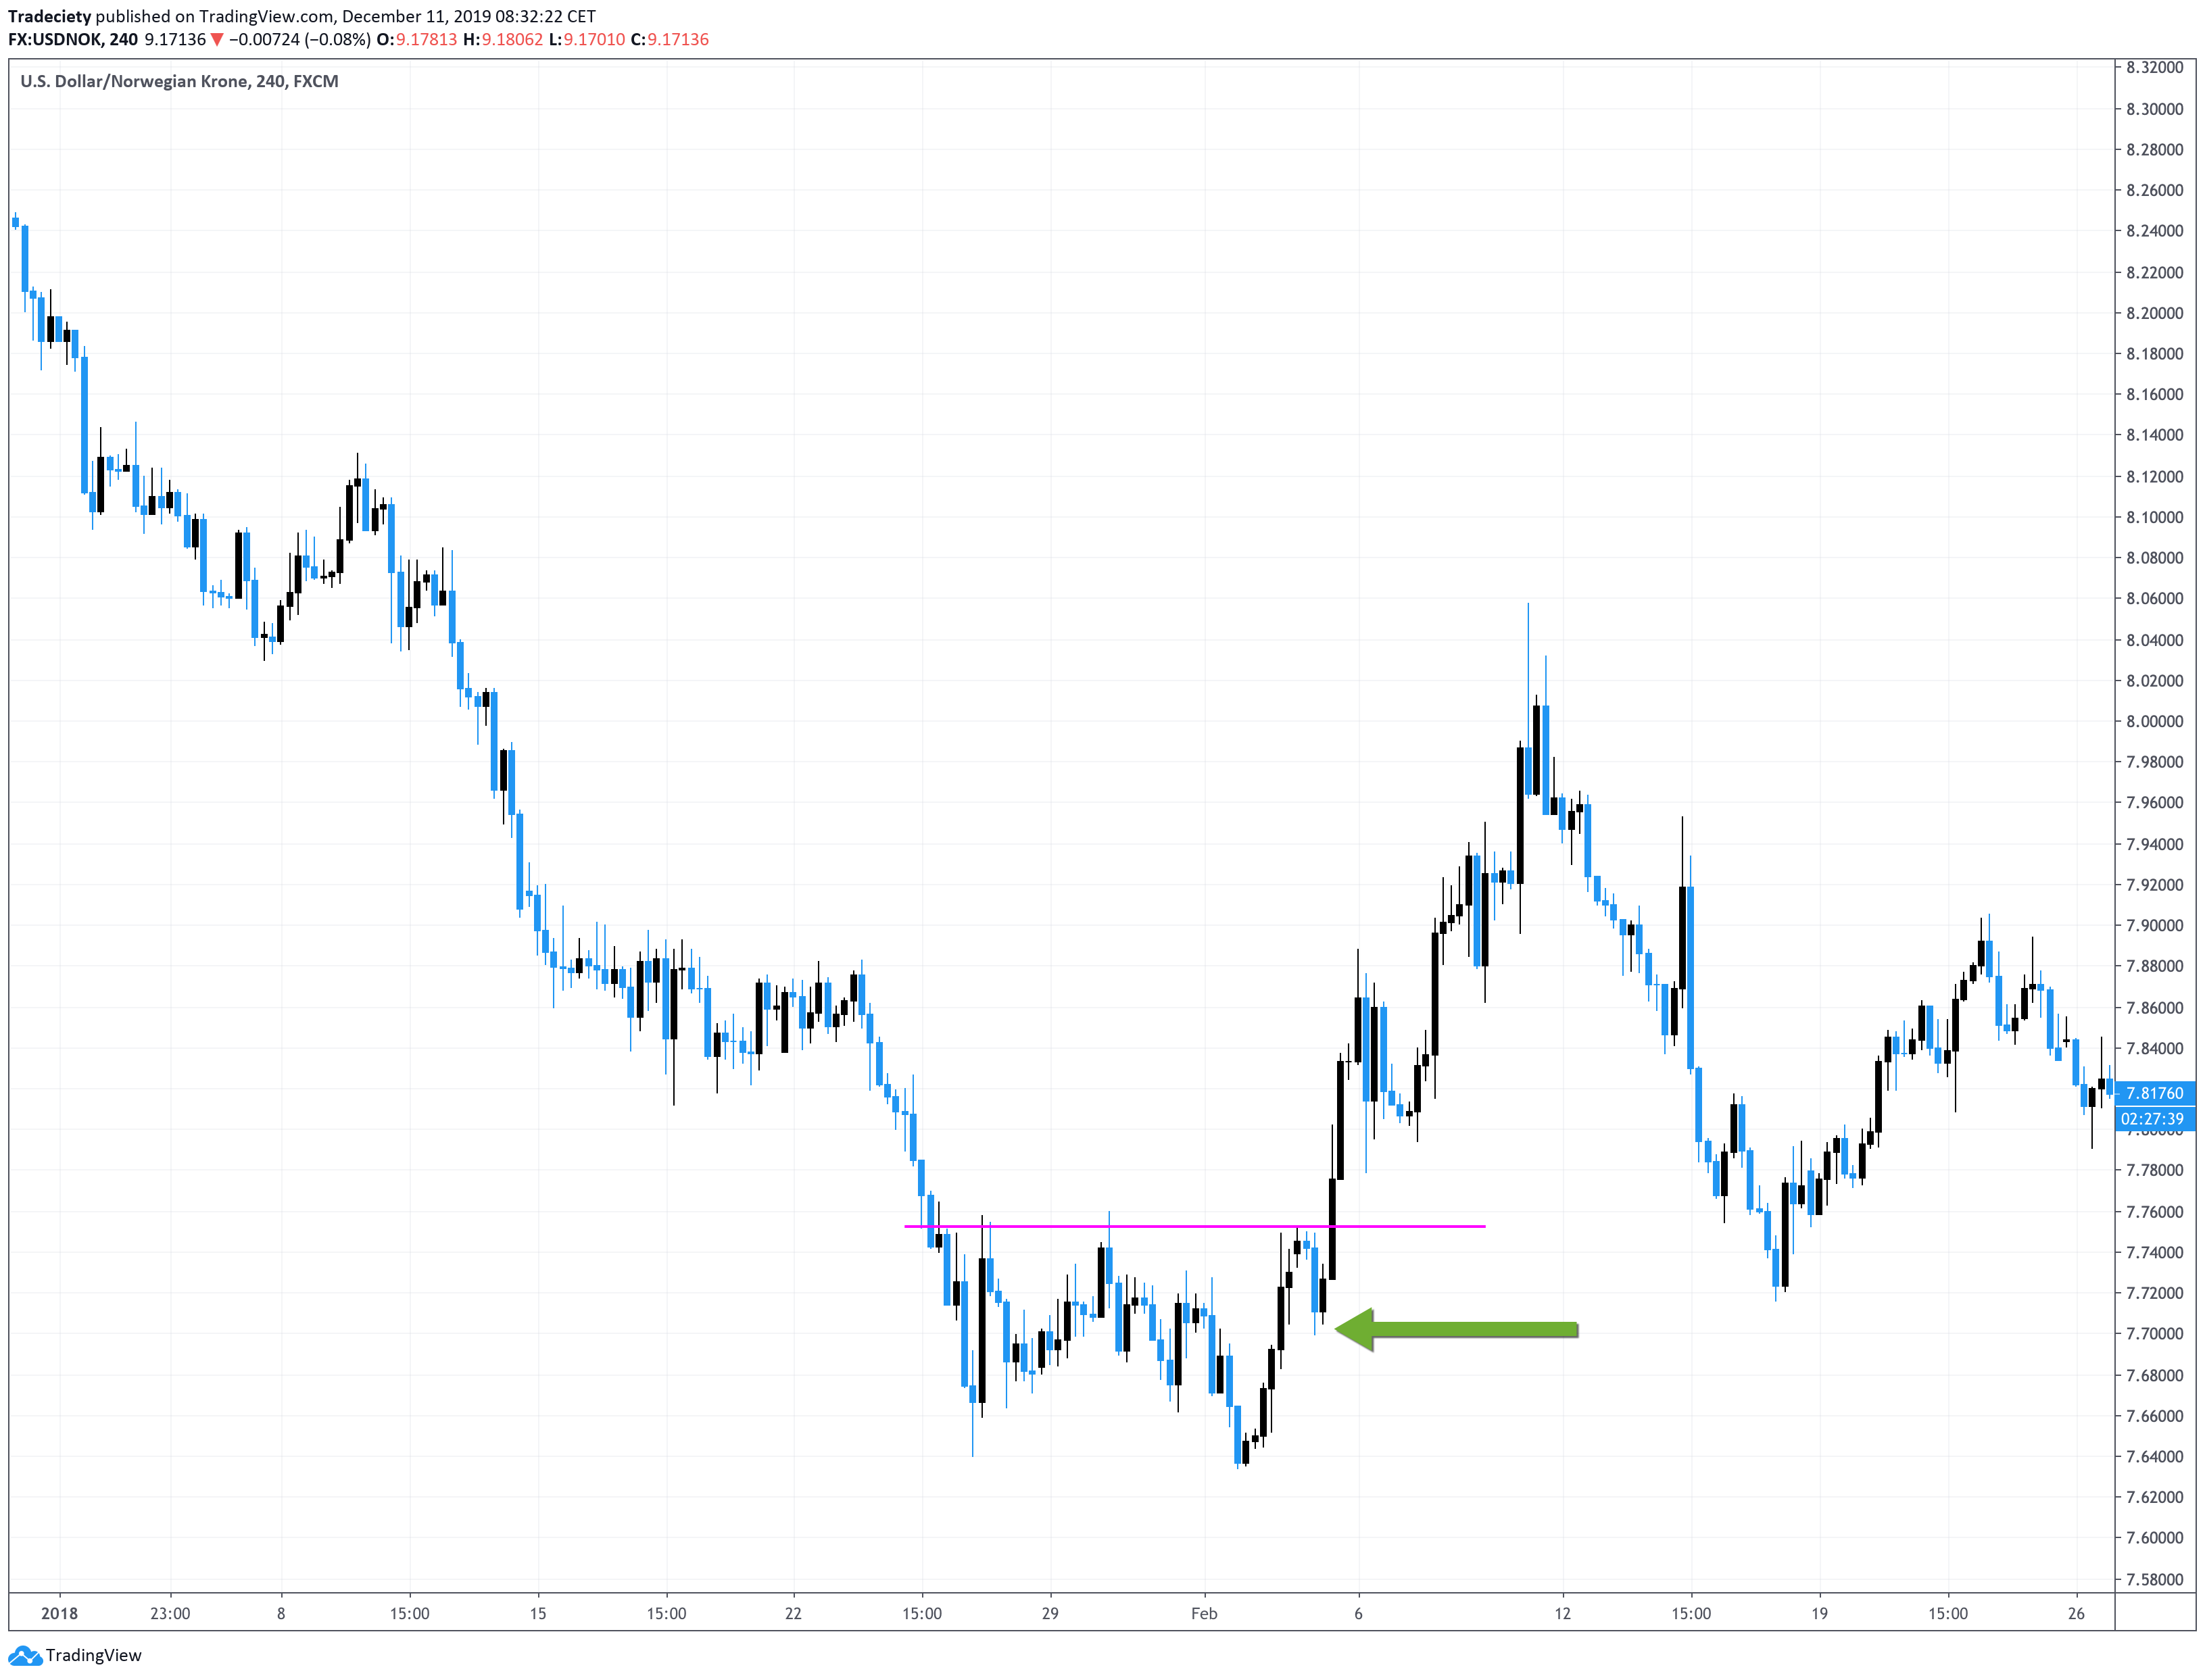
In the screenshot below, we can nicely see this principle at work. We are able to identify a solid horizontal resistance level with multiple touchpoints. The most interesting part about this resistance level is how the price traded into the level. Each time, the price came back into the level, the following pullback became shorter and less strong. The green arrows indicate this pattern and you can see that the price started making higher lows when the price traded into the level.
This means that the sellers were not able to push the price lower as easily. And, secondly, the buyers stepped in sooner each time to drive the price back up. Both things highlight the shifting power dynamics between the buyers and the sellers.
We strictly do not recommend trading a breakout before the price actually broke out of the structure, but if you can identify a breakout that comes with such a lower bounce pattern, you are looking at a high probability setups. At the same time, once you start seeing the lower bounce develop, pay close attention to the price action and get ready for a move.
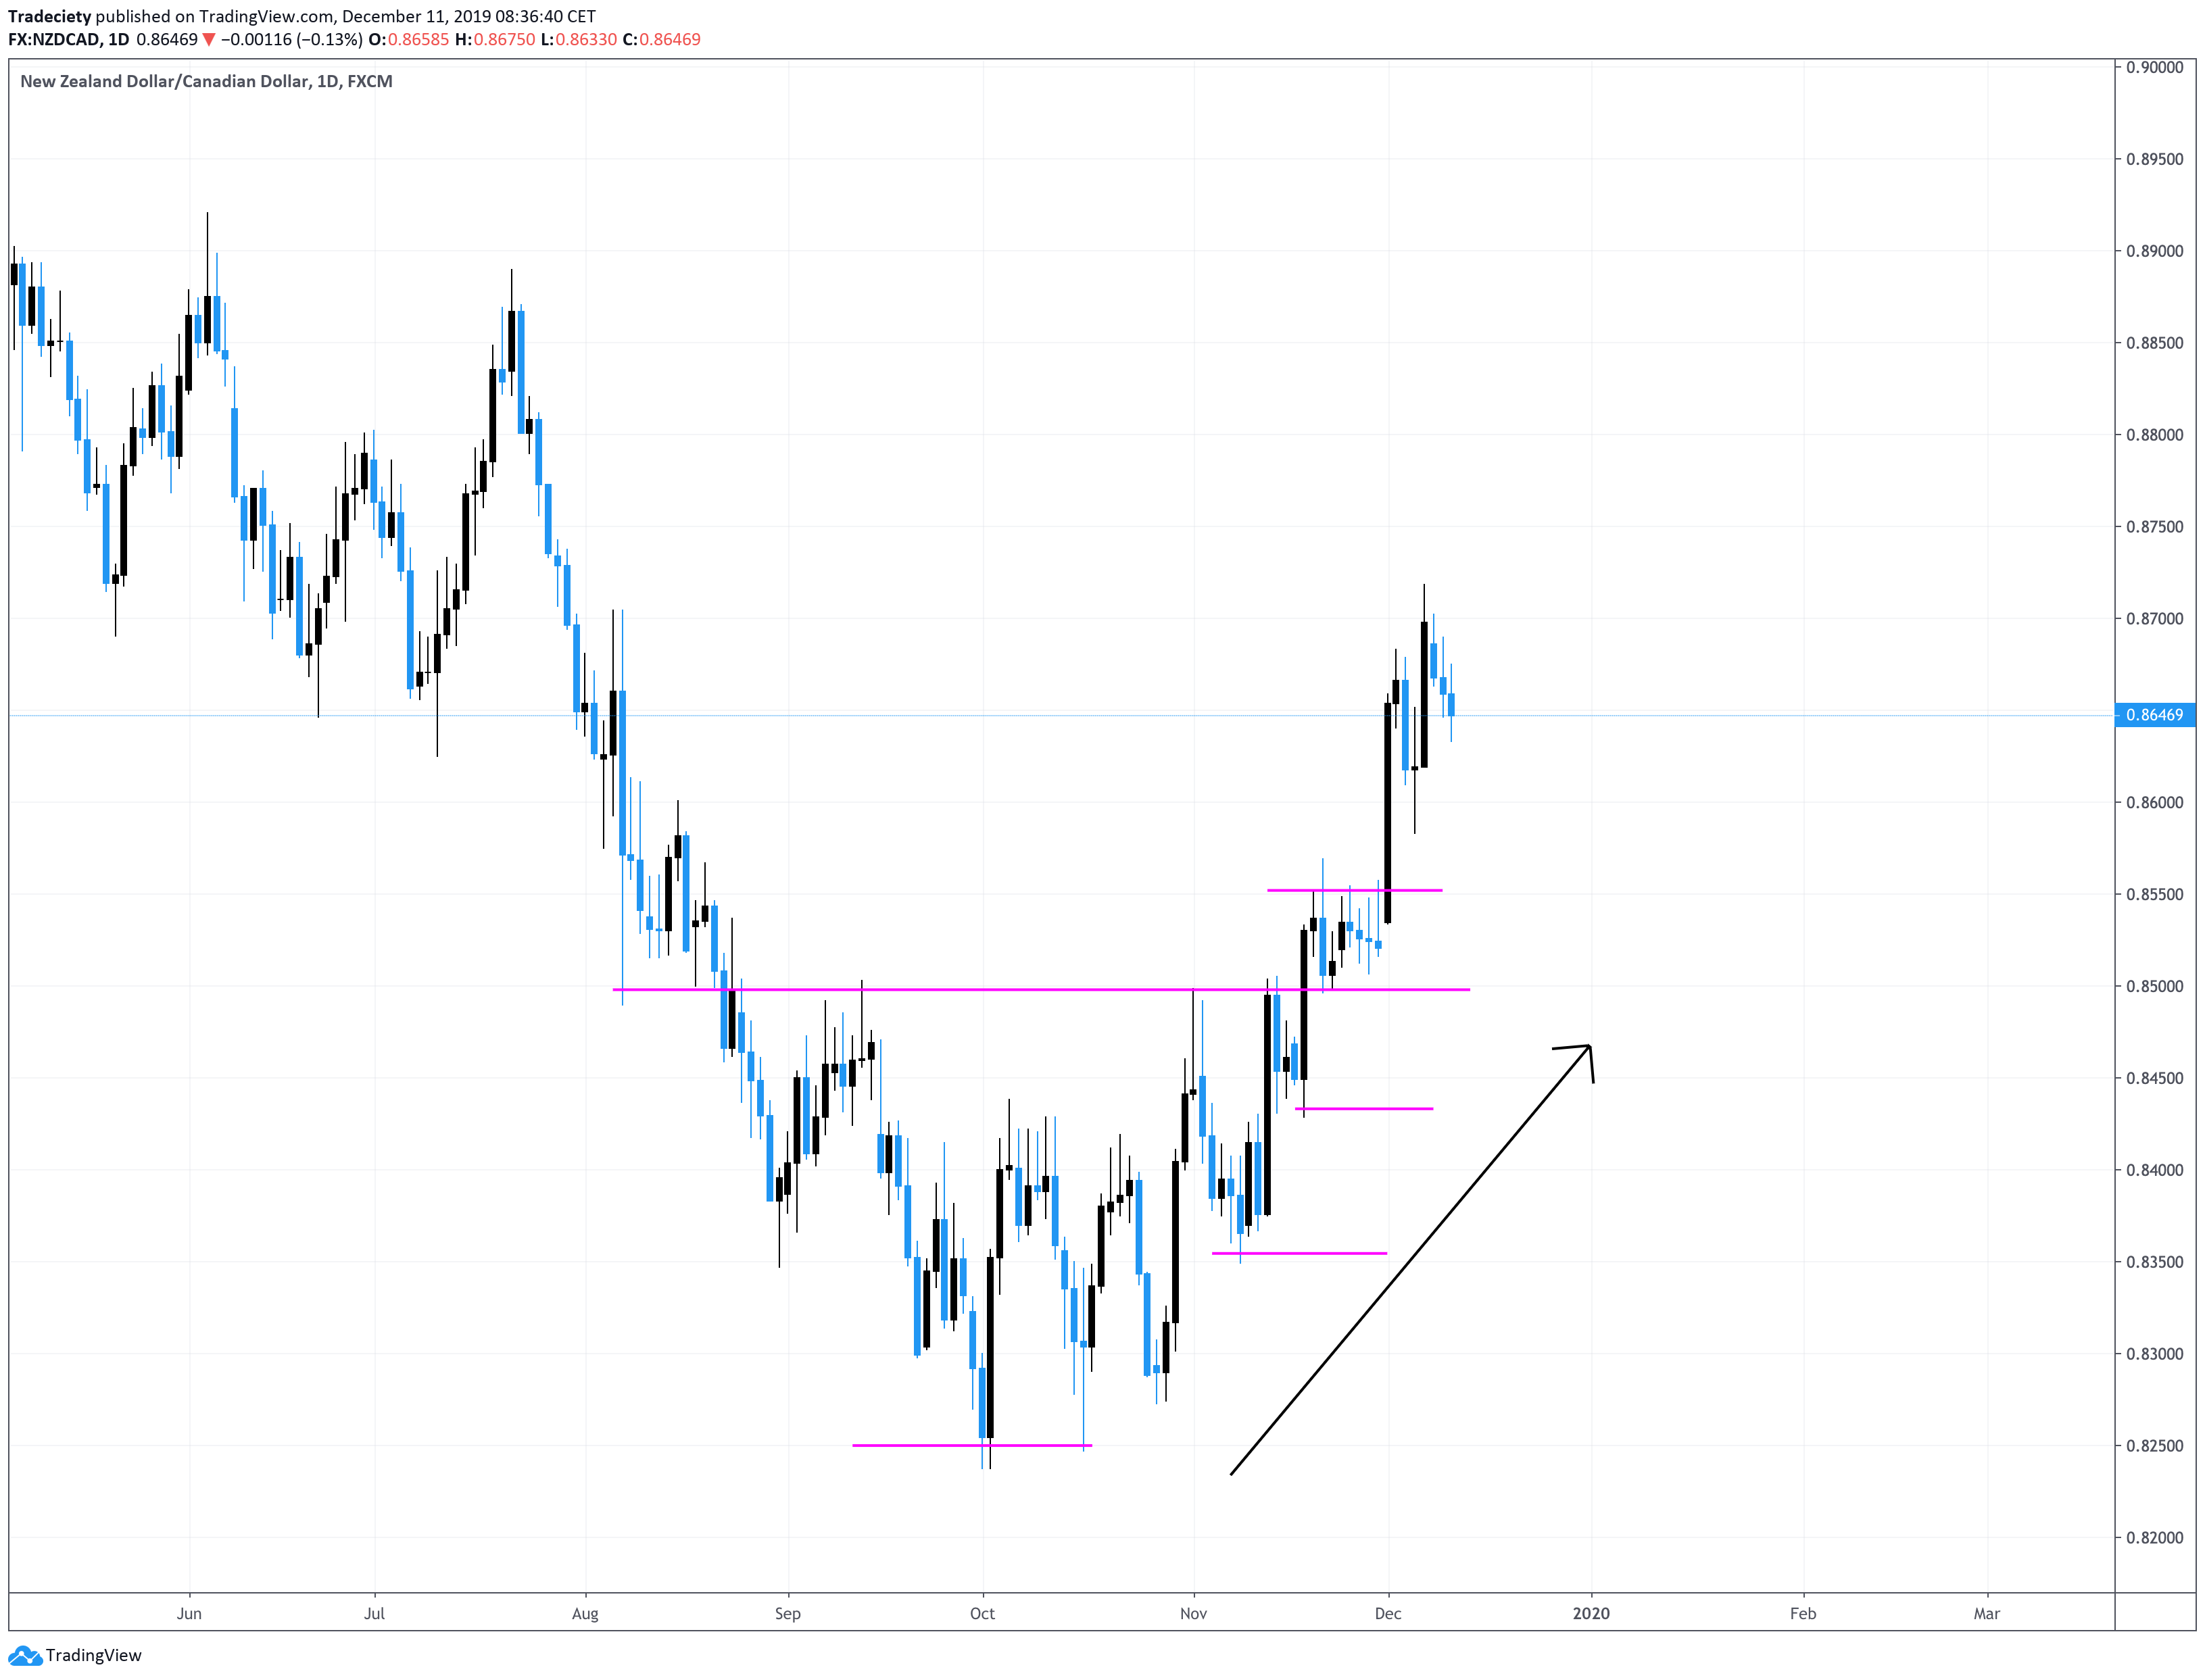
I talked about a very similar trade of mine in a recent video, and the screenshot below shows a great lower bounce breakout.
The premise is that you can identify a slowing trend and then draw a horizontal support/resistance level at the end of the trend. Then, each time the price came back into the resistance, the price wasn’t able to reach the lows anymore. This already indicates that the previous downtrend is likely to be over and that more buyers are now entering the market.
Just before the breakout, the price showed the lower bounce and the price barely moved away from the level. Now, the sellers have almost completely withdrawn from the market. The subsequent breakout was very strong and the breakout candle closed well above the resistance.
Again, it is very important to always wait for a complete break and close beyond your breakout level. Amateurs enter their trades too early because they fear that they are going to miss it. But you need to get rid of such FOMO-driven beliefs. Always wait for a complete close of the breakout candle to avoid fake/false breakouts.
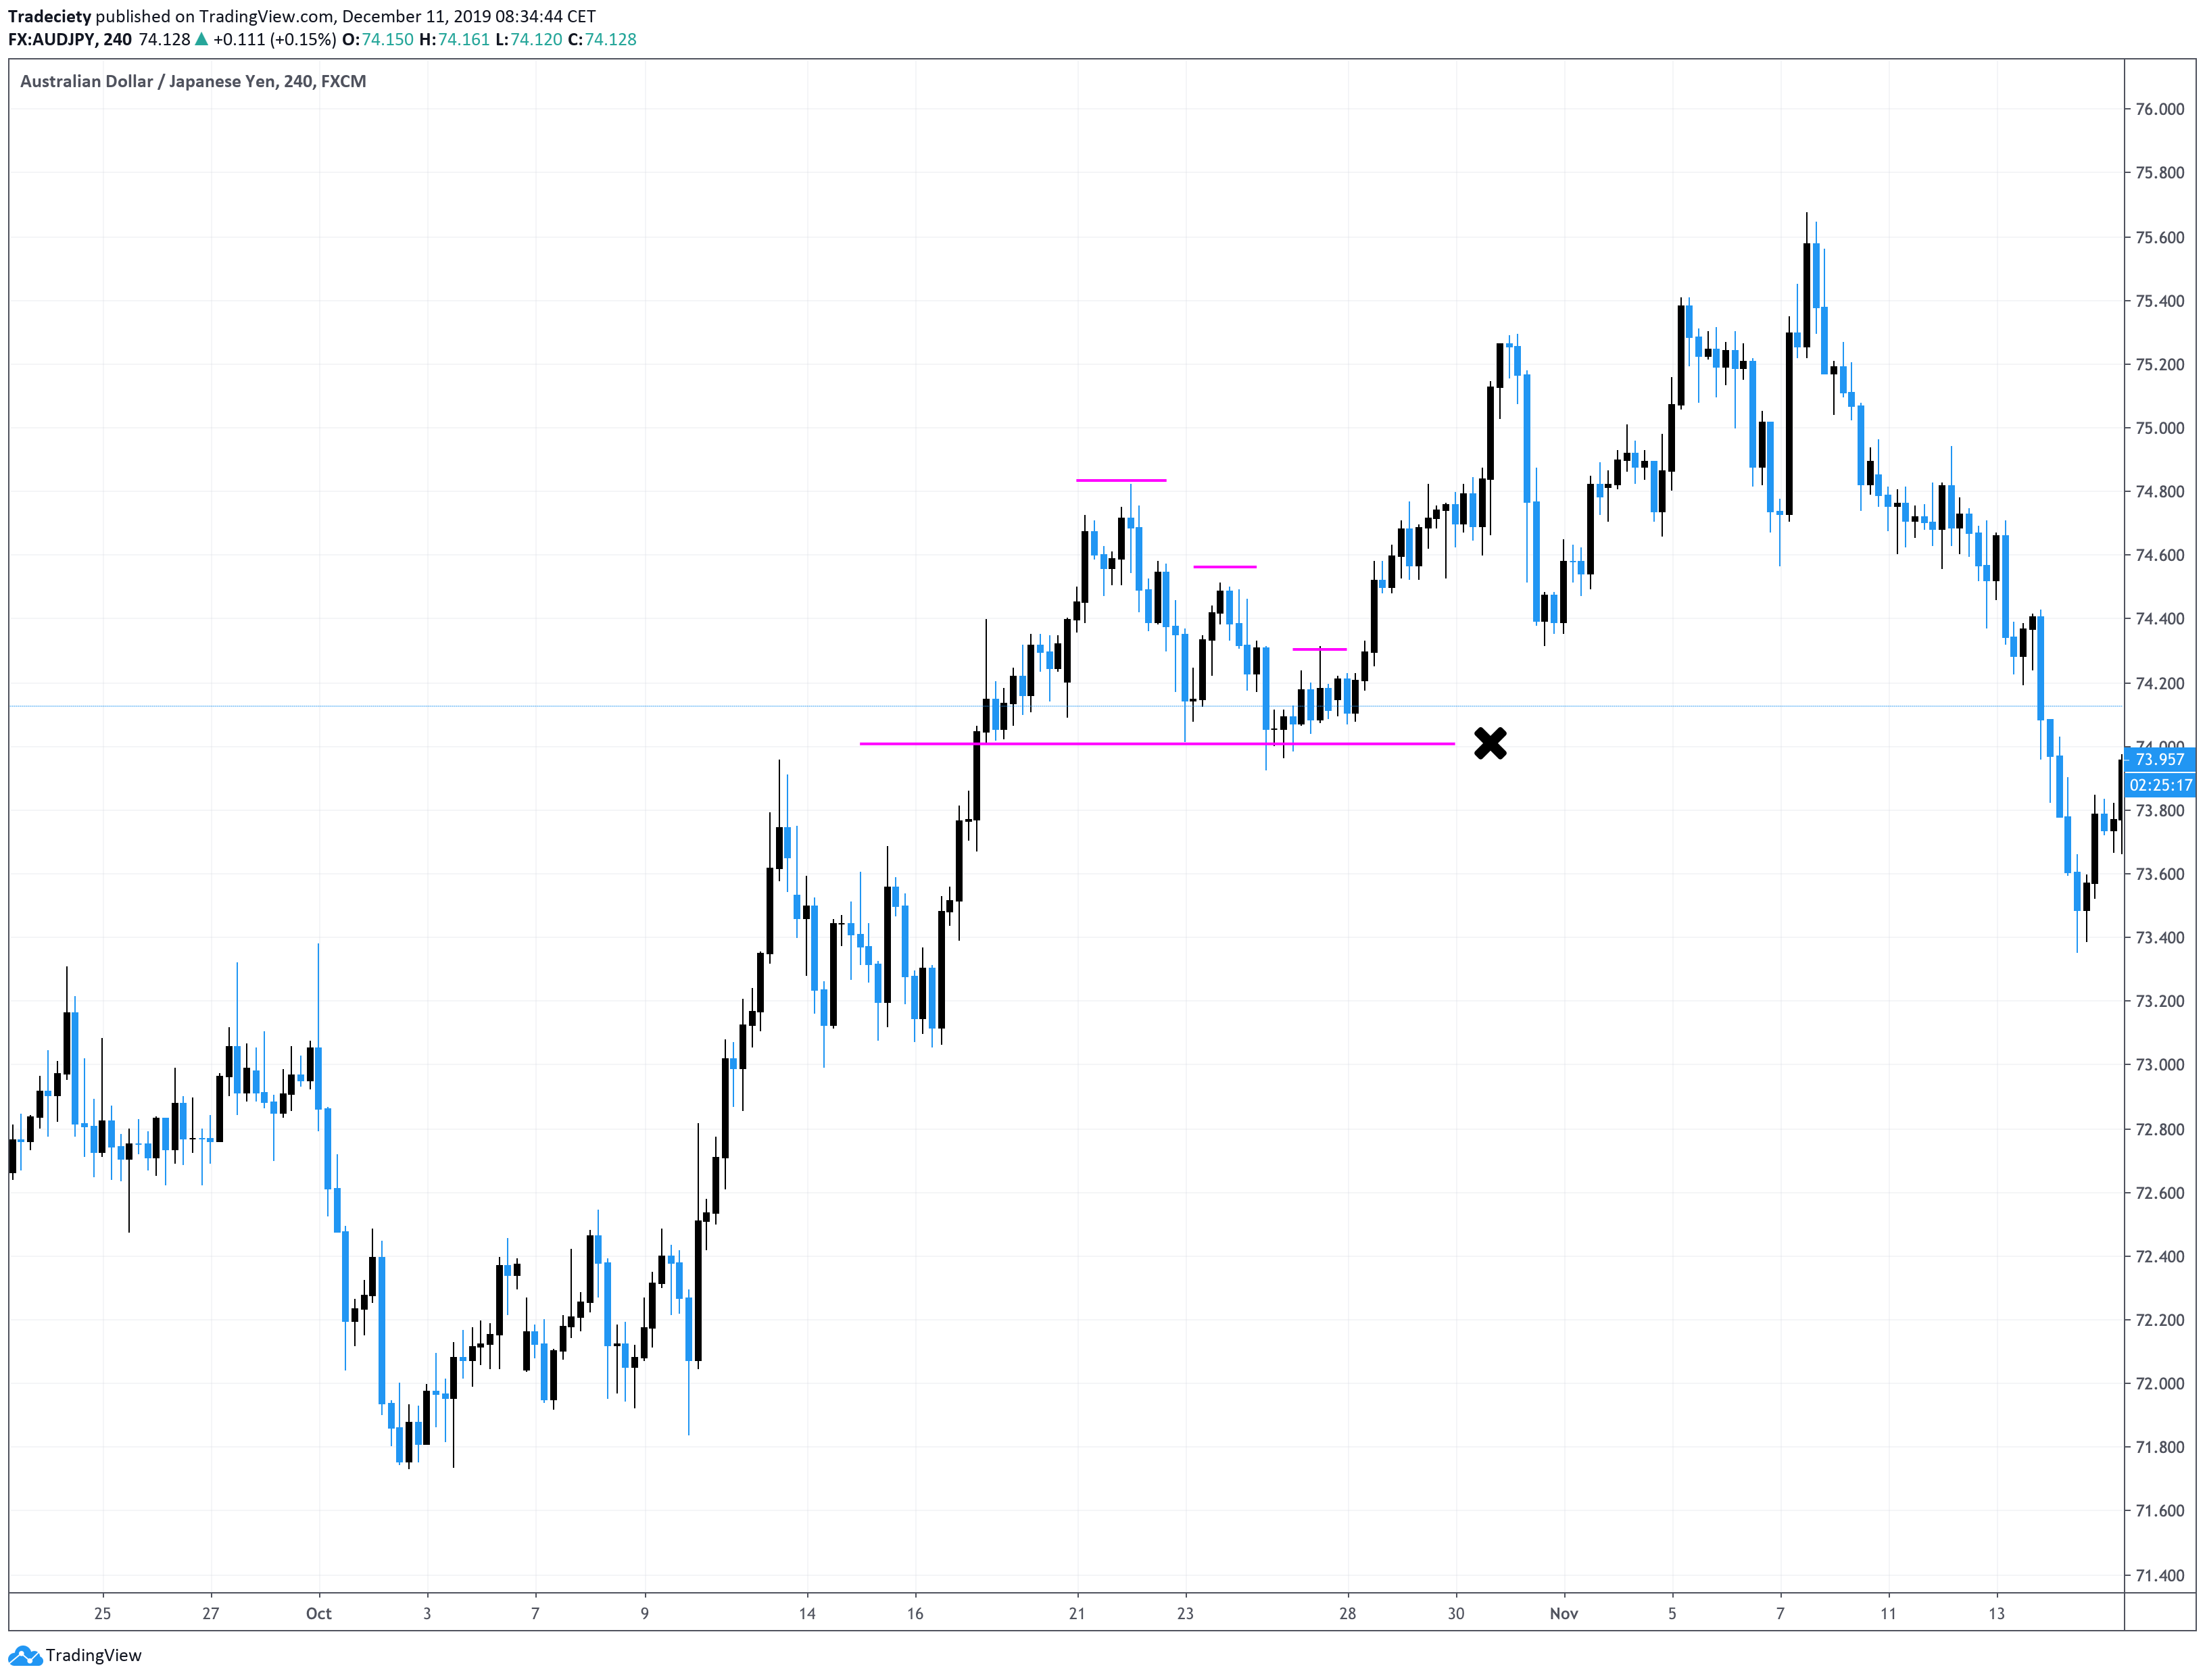
The scenario below shows why waiting for a close of the breakout is so important. Sometimes, you will be able to find the lower bounce at a support/resistance level and the breakout does not even happen. The lower bounce in the screenshot below looks extremely promising, but the price never fully broke out.
Waiting for a candle close is a small detail, but it can make a huge difference. Resist the temptation to jump in too early.
You will start noticing the lower bounce around all patterns and it is a great add-on confluence pattern for your pattern breakout trading. In the screenshot below, the lower bounce occurred during a range bottom. The previous downtrend ended and the market entered a sideways consolidation with a double bottom. Then, before the actual breakout, the price formed a lower bounce and the price didn’t even come close to the previous market low. This is a strong signal that the sellers have withdrawn and the buyers are slowly taking control.
Trading doesn’t have to be that complicated and many traders will dismiss this lower bounce pattern. But once you start paying attention to those little nuances in price action trading, you will be able to understand the buyer-seller dynamic on a much deeper level.
Never forget that behind every candle and behind every move on your chart, buyers and sellers are interacting. Then try to understand which side is gaining strength, how the powers are shifting and what it means for your patterns and the chart context.
external link:


We have been trading supply and demand strategies for over ten years, and they have stood the test of time remarkably well. Supply and demand is...

3 min read
Choosing the right trading journal is essential for traders wanting to analyze performance, refine strategies, and improve consistency. In this...

3 min read
“95% of all traders fail” is the most commonly used trading related statistic around the internet. But no research paper exists that proves this...