3 min read
A Year with "The Trading Mindwheel": Transforming Trading Through Psychology
The following is a guest post from Michael Lamothe.
I'm Michael Lamothe, and today marks an extraordinary milestone: the first anniversary of "The...
Today, I want to talk about a topic that can make a huge difference in anyone’s trading life and performance. Over the past few months I have been working with hundreds of traders and I have found that abandoning potentially profitable trades too early is a big problem. Many traders get easily scared out of their trades even though there are no real reasons.
So in this article I want to discuss a few price scenarios and share some tips about how to interpret a price chart the right way so that you can stay in trades longer and trade with more confidence.
When it comes to reading and understanding charts, there are actually only very few things that you need to know to correctly interpret a move.
When to stay in a long/buy trade:
| Candlestick analysis | Chart pattern and waves |
| As long as bullish candlesticks close near the top of the candle | As long as price keeps making higher highs and higher lows |
| Retracements are very short and only consist of a few and/or small candlesticks | Consolidations are not too deep or just sideways |
| Volatility is low: wicks of candlesticks are relatively small | Consolidations retest previous resistance as support on the way up |
| After a bearish candlestick, the bullish candlestick recovers losses quickly | Breakouts above previous highs are strong |
Of course, the same works for sell trades the exact same way. And although this sounds veeeery basic, we will soon go over a few chart studies and examples and it will become clear why this is such an important and helpful way of looking at charts.
Whenever I tell traders that they should stop watching their price charts in-between candles, I usually always get weird looks and strange comments. But I have yet to meet a trader who didn’t benefit from following the advice.
Especially if you are a new, inexperienced or struggling trader this is a MUST for you. Just think about all the times to jumped on a candle that looked particularly good but once the candle had closed, everything had changed.
Most traders are always on a trade hunt and prematurely jump on trades. Waiting for a candle to fully close will be a game changer and you can remove a lot of noise from your trading.
Of course, there is a tradeoff: sometimes, price will take off without you but over the long term, it will most likely have a positive impact and reducing noise should always be a priority.
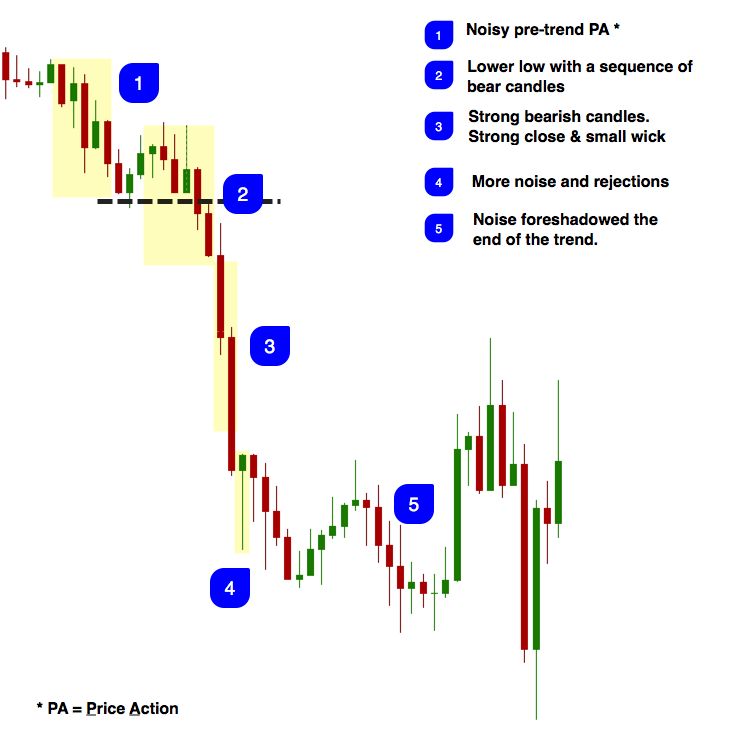
This is a classic trend pattern and many reversal trades start like this. You have the initial pre-trend phase (1) where price moves lower slowly and then puts in a support area and a consolidation; those periods can be noisy and should be avoided. Once the breakout happens (2), candles then suddenly turn red only and momentum accelerates during the downtrend (3). It’s likely to see lots of back and forth during those high momentum candles and here the concept of no-mid-candle-decisions can be a life saver because those periods when things move fast and traders quickly believe that a small bounce will eat up their profits are dangerous. Just looking at the closed candles would have shown you that there is nothing to worry.
Then suddenly price faces more opposition (4) and volatility increases with larger wicks. This is not automatically a sign to cut a trade because the candle close doesn’t suggest much bullishness yet, but it’s heads up signal. Then price enters a range market (5) with back and forth price action without any direction or momentum. A short positioned momentum trader must acknowledge now that and exit the trade to avoid getting whipsawed.
As you can see, there is no need to immediately react to price and many traders mistakenly believe that they must babysit their trades always. Rarely does price completely reverse on you during a good trending market. Just take it candle by candle and pay attention to what price is telling you.
The trend in example 1 is the textbook example but not always do we get such a nice pattern and there it’s even more important to read the structure.
Most trades will start like this with a strong initial move (1) which is the signal that a new trend is on its way; even reversals often start with an initial high momentum move. The next phase is a normal consolidation (2) and there is nothing to worry about – it’s a natural price rhythm. This is nasty (3) and the high volatility spike probably scared out many traders who watched the candles forming. But you can see it’s just a neutral bar with no real direction and long wicks – probably a news driven candle. The next candle then reverses and the trend continues; you can see that we never had more than 1 bearish candle and there was no reason to exit the long trade. Now we see more selling (4) and it’s the first time we get 2 strong bearish candles. Price does not fully reverse but enters a sideways market and the trend is over. We also never saw a new bullish momentum sequence. Now we have the reversal signal (5) and price made its first bearish momentum sequence even breaking the lows which then foreshadowed the bearish trend (6) afterward.
Again, you can see that price rarely just completely reverses but there are usually sudden clues that build up over time.

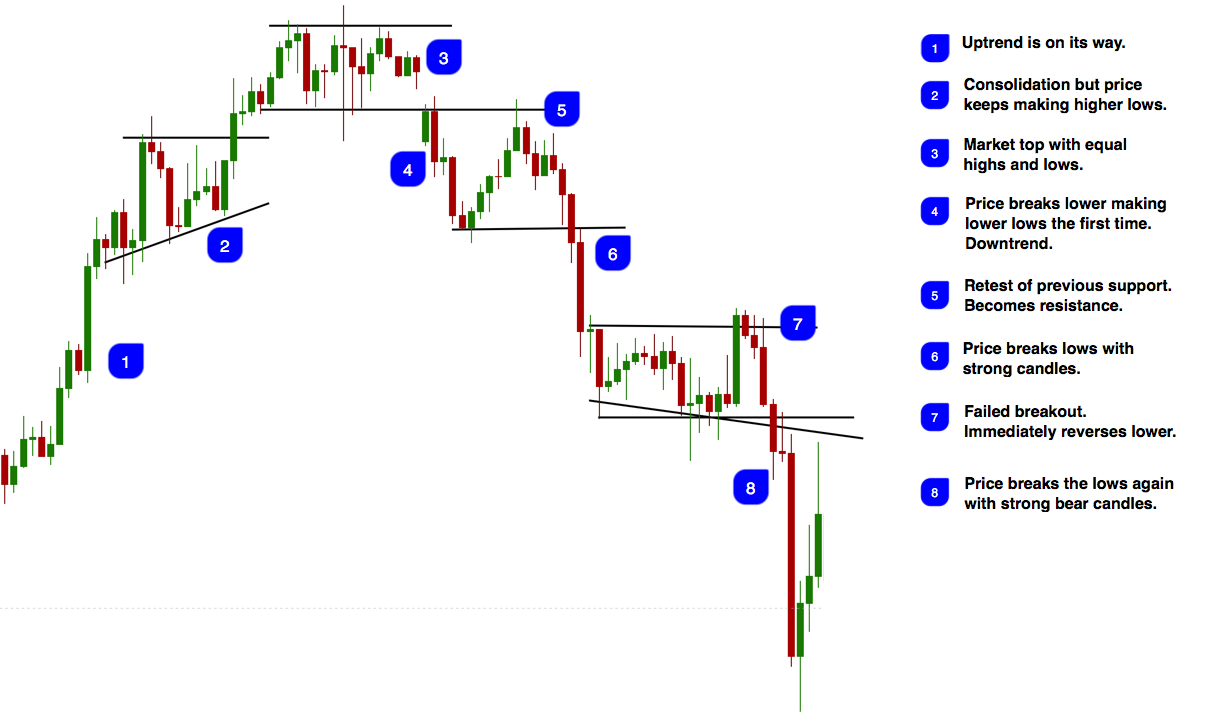
Now we look beyond individual candle sequences with the next two examples. Again, the trend starts with a high momentum phase (1) and with strong trending candles. Then, we see a regular consolidation (2) where price kept making higher lows and the selling was weak. Then price enters a prolonged range (3) which is a neutral phase but it highlights that the bulls have probably ran out of power. Then price breaks the lows (4) and reverses the direction and it is followed by a classic break and retest pattern (5); this is a high probability trend continuation pattern as long as the retest holds. Here we then see high momentum again (6) and price breaks previous lows with strong candles. Next we see a failed breakout (7) but nothing is perfect so we have to live with a few failed signals here and there. But price immediately dips back into the range and picks up momentum – there was no follow through on the failed breakout which is a good signal for bears. Then we keep breaking the lows (8) and the elling accelerates with high momentum bearish bars.
It is obvious again that looking at candle close information can improve the quality of the trading and reduce lots of noise. Price never reverses direction in one straight candle so you must understand that time is your friend as a trader J
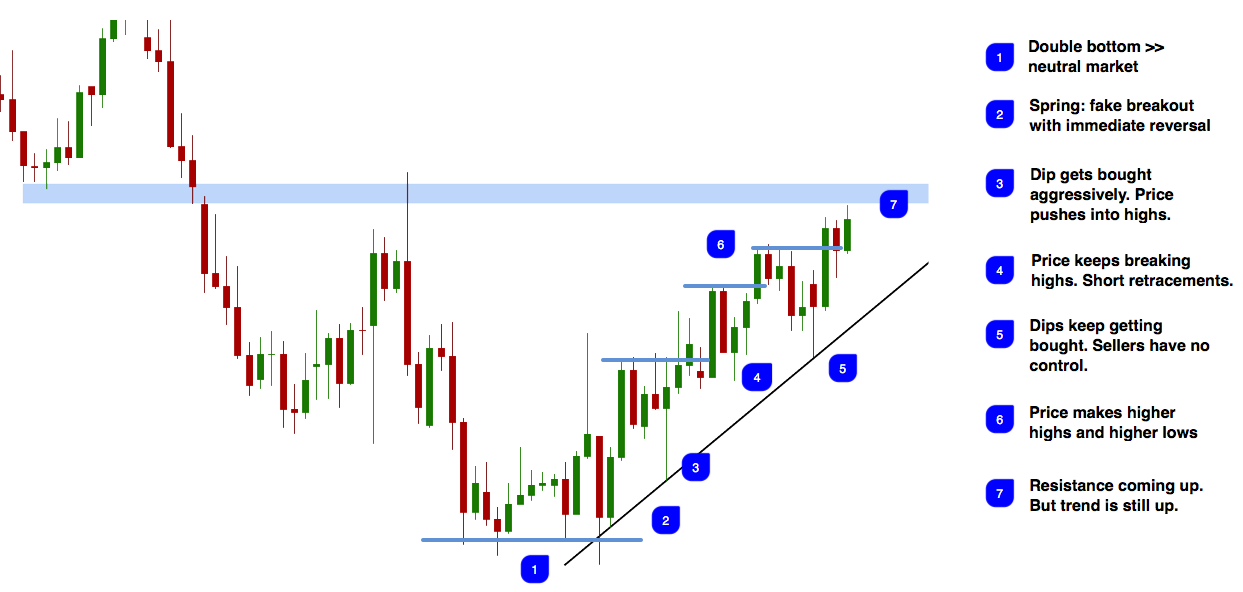
I got bombarded with questions about the following chart because people kept shorting on the way up but let’s explore it step by step.
The trend had its origin at a base pattern with multiple lows (1). The spring is a pattern where price makes a breakout attempt but then immediately reverses into the opposite direction (2). Now we are starting a new trend (3) and price made higher highs and the dips got bought aggressively which is a bullish sign. The momentum continues and bulls are in control (4) and there are very few red candles. Dips keep getting bought (5) and price also makes higher highs still (6). This is a very obvious trend structure when we look at it with objectivity. At no point did we see any evidence that sellers are stepping in and just following the momentum is so important as trades, whether you are a trend trader and ride trades or a reversal trader and stay away from strong momentum periods. It’s so crucial to read momentum objectively.
As I write this, price seems to pick up more selling momentum but the new daily candle is just a few hours old and as I said, things can change rapidly during candles. So stay away from jumping on signals which haven’t been confirmed and always always follow momentum.


external link:
external link:

3 min read
The following is a guest post from Michael Lamothe.
I'm Michael Lamothe, and today marks an extraordinary milestone: the first anniversary of "The...
3 min read
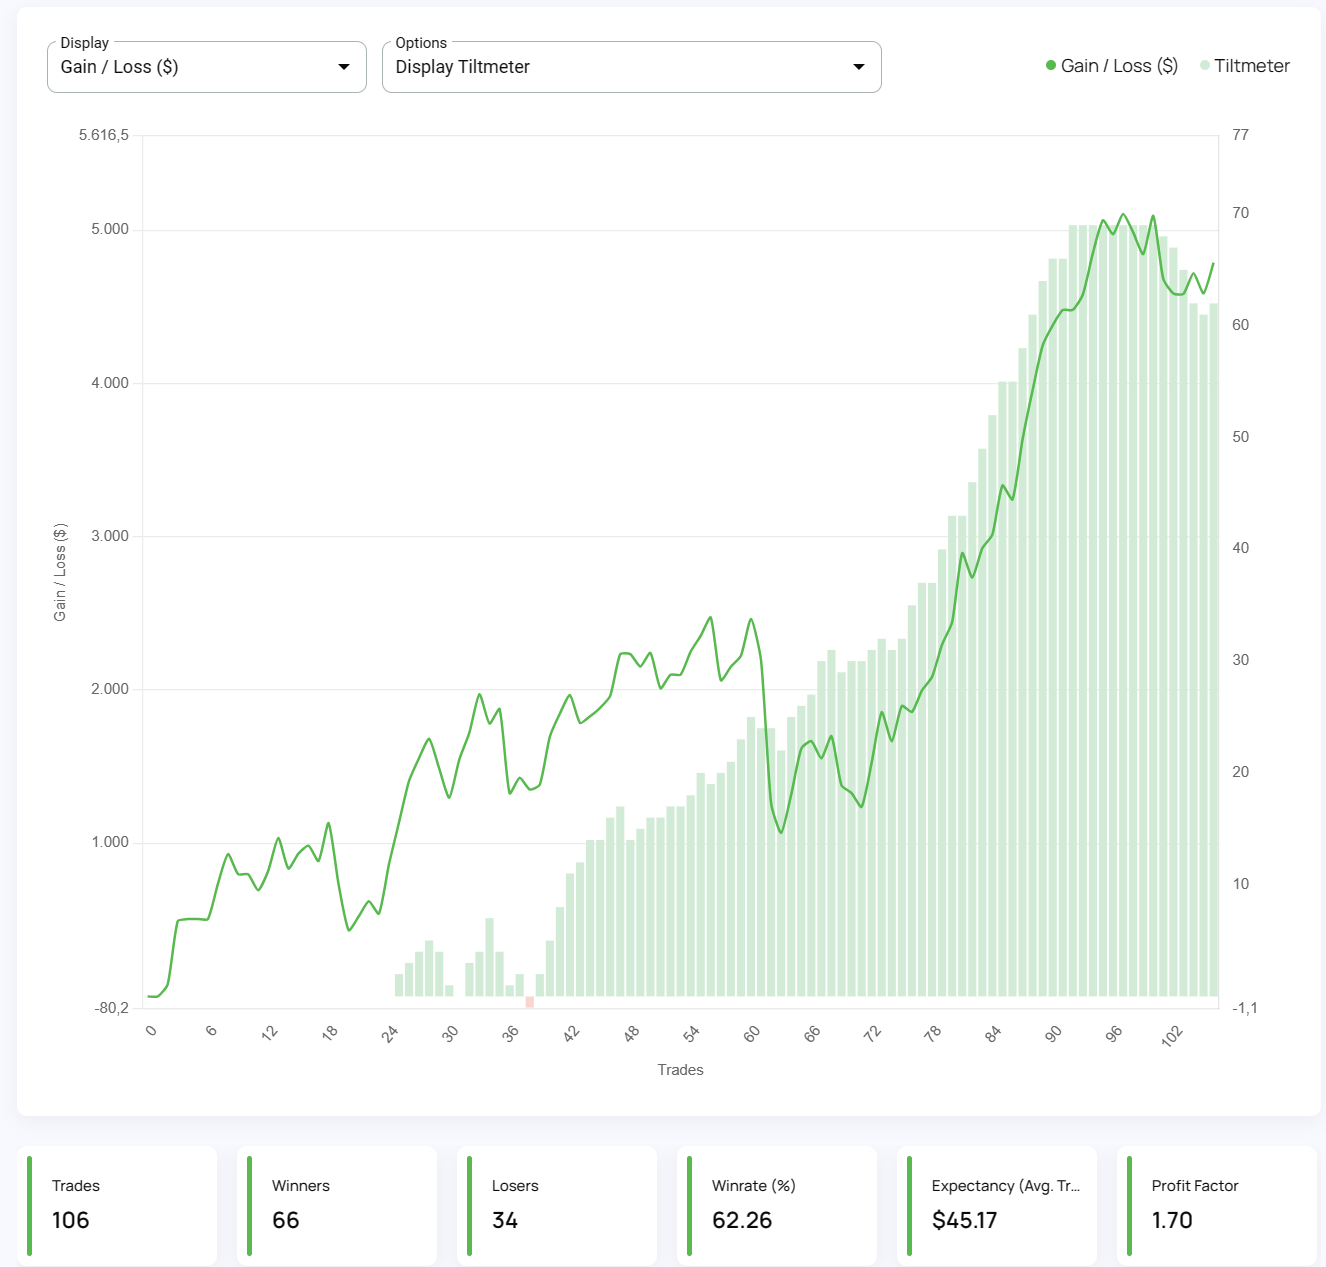
It's easy to get discouraged by losses and question your every move. But what if there was a way to track your progress, learn from mistakes, and...

8 min read
Dive deep into the world of finance and high-stakes trading with this selection of movies and documentaries! From the exhilarating thrill of...