Supply and Demand Trading in 2026
We have been trading supply and demand strategies for over ten years, and they have stood the test of time remarkably well. Supply and demand is...

Price action trading and candlestick patterns are probably the most commonly used concepts of technical analysis. At the same time, there are lots of misconceptions and half-truths floating around which cause confusion and wrong trading decisions.
In this article, I talk about the 5 best candlestick patterns and I explain how to trade candlestick patterns like a pro. I also provide a different view on candlestick analysis and explain the most common problems traders have with price action trading.
1) Context and location
All concepts of price action and candlestick trading are based on this first principle. Context means that you ALWAYS compare the current candlestick to the most recent price action. Too many traders put way too much importance on individual candlesticks and forget to look at the big picture.
Location means that you only trade candlesticks at important price levels. A pinbar, for example, at a previous double top/bottom is more meaningful than a random pinbar in the middle of your charts.
I explained here how to find the best levels: 7 tips for strong price levels
2) Size
Candle size can tell you a lot about strength, momentum and trends.
When candles are suddenly getting larger, it often signals a stronger trend. Small candles after a long rally can foreshadow a reversal or the end of a trend.
3) Wicks
Long wicks at key support/resistance levels are often a good hint for potential reversals. Wicks usually show rejections and failed attempts to move price higher/lower. Long rejection-wicks happen frequently around double tops/bottoms and can be a good pattern by themselves. A large candle without wicks, on the other hand, is usually a sign of great strength.
However, not all wicks are reversal signals. I explained here how to lose your fear of wicks:
4) Body
The body represents the distance the price has traveled from the open to the close.
The body always needs to be interpreted in the context of the wicks and the size. A small body with large wicks shows indecision, a large body without wicks shows strength, a small body without wicks shows a lack of interest and a large body with long wicks shows high volatility and lots of trading activity.
Open a book or a website that is specialized in candlestick trading and you will most likely find dozens and dozens of different formations. In my opinion, you should NOT try to remember them and it can even harm your trading if you get into this template-thinking mindset.
With the 4 principles above you can already interpret 90% of all price charts and you do not need to memorize any articifial patterns.
With the 5 examples below I show you how to make sense of the best candlestick patterns based on the 4 discussed principles.
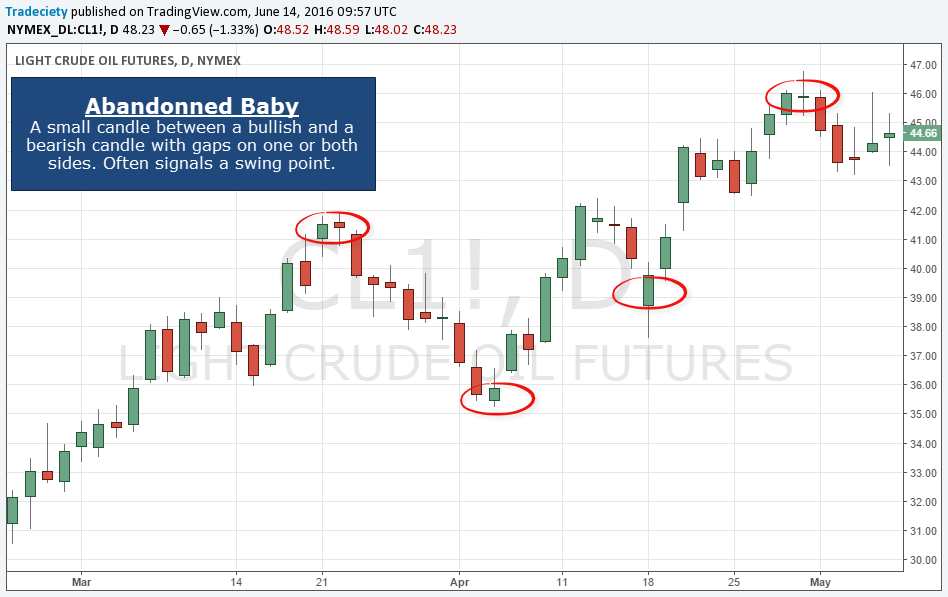
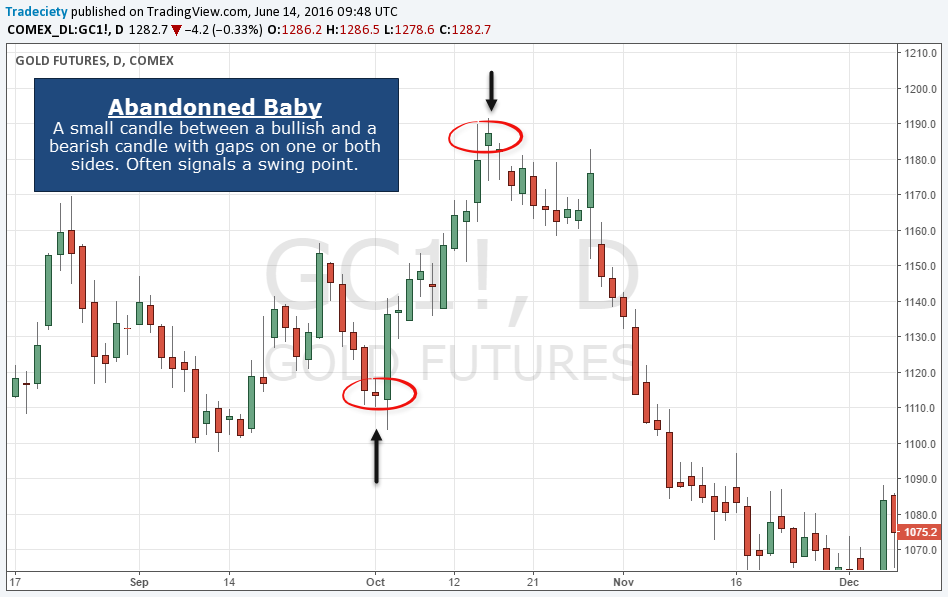
The abandoned baby or evening star are most commonly used on daily charts but a slightly modified version also appears on the lower timeframe.
Candle formation and sequence:
Important concepts and features: The gap is not mandatory and the candle sequence is the key to this pattern. The small candle between the larger ones often comes with wicks to both sides which then confirms the market top/bottom and the fight between bulls and bears.
Meaning: The abandoned baby/evening star pattern is a classic reversal pattern. After a strong trend, price gaps higher but fails to keep on going higher. The third candle is a strong move into the opposite direction, confirming the change in trend direction.
The most important part about this pattern is that you wait for the third candle which validates the reversal and the pattern.
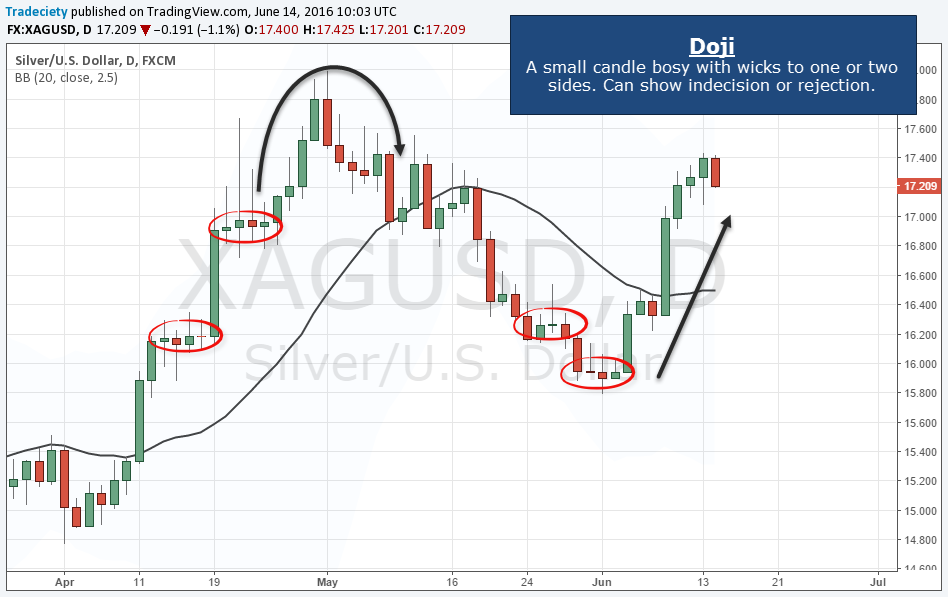
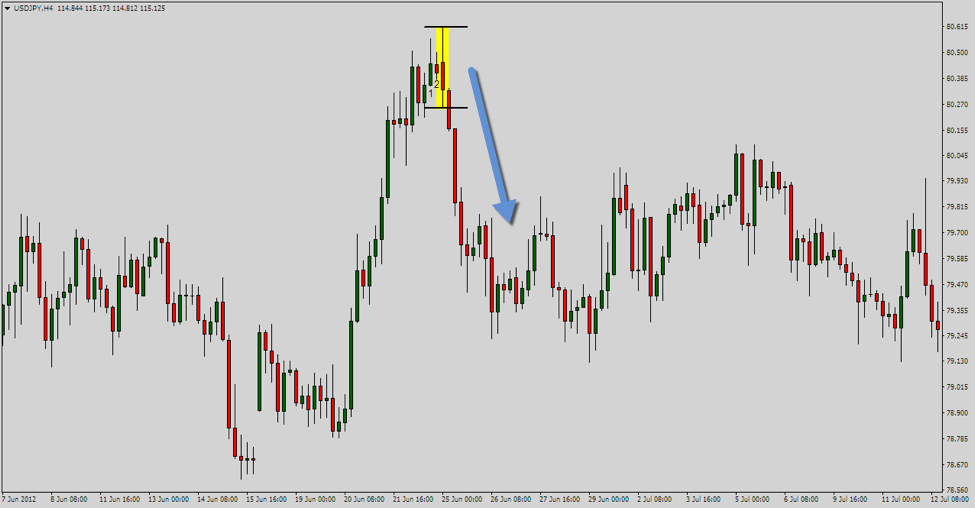
Dojis are common and they have many different names. At the same time, they can be interpreted in many different ways as well and their true meaning depends on the context on your charts.
Candle formation: A Doji candle typically has a very small body and wicks to both sides. The wicks have normally pretty much the same size. Dojis frequently occur after strong trend moves and/or at previous support/resistance levels.
Important concepts and features: A Doji alone is not a signal and should not be traded by itself. A Doji is a “heads-up” candle. A Doji on the 4H chart is often not as meaningful, especially in Forex trading, because Dojis can happen easily during inactive trading sessions.
Meaning: A Doji is an indecision candle. After a long and strong rally, a Doji shows that the market has paused and is now reevaluating the situation. The size of the wicks can often tell a lot about the trading dynamics during a Doji – long wicks indicate a strong fight between bulls and bears and small wicks show inactive trading.
A Doji is often a good opportunity to either trail your stop because a reversal is just as likely or take partial profits on your position to protect yourself from a market turn.
The engulfing or outside bar is a strong signal, offering reliable signals if it occurs at the right location and context. The engulfing bar can be both a trend reversal or a trend continuation signal.
Candle formation and sequence: A smaller candle, followed by a larger candle that completely ‘engulfs’ the previous one. Usually, the open AND the close of the second, larger candle have to engulf the previous one for the best signals.
Important concepts and features: An engulfing pattern is more meaningful when it has small wicks and when the second candle is much larger than the first one. Often you can also see a rejection wick at the larger engulfing bar which makes the pattern stronger.
Meaning: The engulfing bar can be both a trend reversal or a continuation signal, depending on the direction of the second candle. When you see a large red candle after a long rally it can signal a trend reversal.
But, during trends, you can often see that engulfing patterns occur during retracements and then this pattern can be used to add to an existing trade or find a new entry.
The engulfing bar shows extreme strength where market participants are completely reversing price action. A lower/higher close of the second bar is also important because many traders watch intraday and daily close/open and use it for order placement.
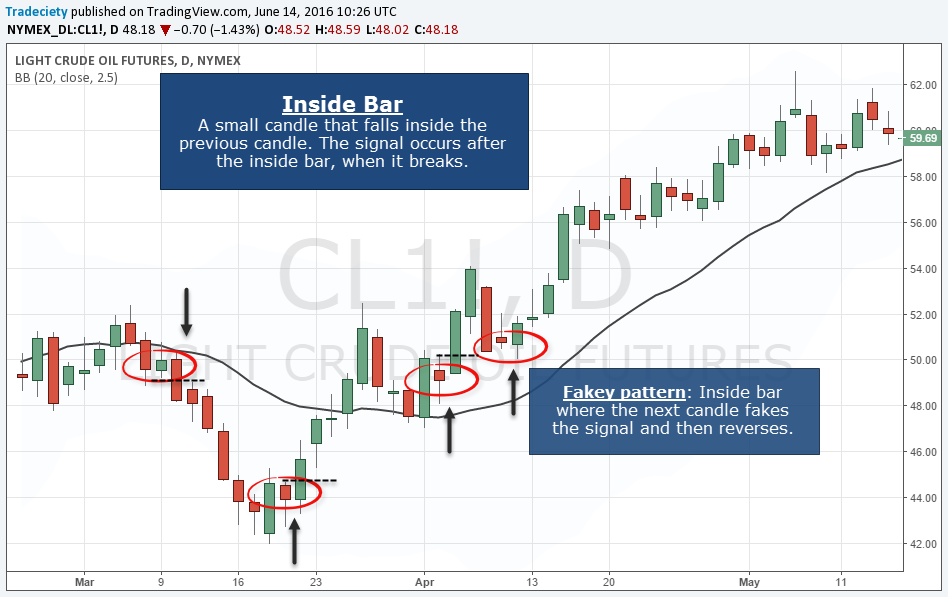
The insider bar is similar to the Doji, but it’s a very common pattern and the psychology behind it is worth exploring.
Candle formation and sequence: The inside bar is the opposite to the engulfing pattern. The inside bar is a small candle that completely falls into the previous one.
The Fakey happens when, after the inside bar, price breaks the high/low of the inside bar and then immediately reverses. A Fakey can, thus, be compared to a fake breakout pattern or a bear/bull trap where price shows a breakout but then immediately reverses.
Further reading: Trading the bull and bear trap
Important concepts and features: Being patient and waiting for the candle AFTER the inside bar is the key to trading this pattern. Most amateur traders use pending orders for their inside bars which makes them very vulnerable to squeezes – this is the reason why you can often see the Fakey pattern after an inside bar.
When trading the inside bar, it’s better to wait one candle too long than entering too early and then getting squeezed.
Meaning: An inside bar shows a temporary pause in trading activity, usually after long trends or before the creation of a new trend. There is typically a lot of accumulation and distribution happening during an inside bar and you can often see explosive moves.
The Fakey is a classic pattern where professionals use the weaknesses of impatient amateur traders.
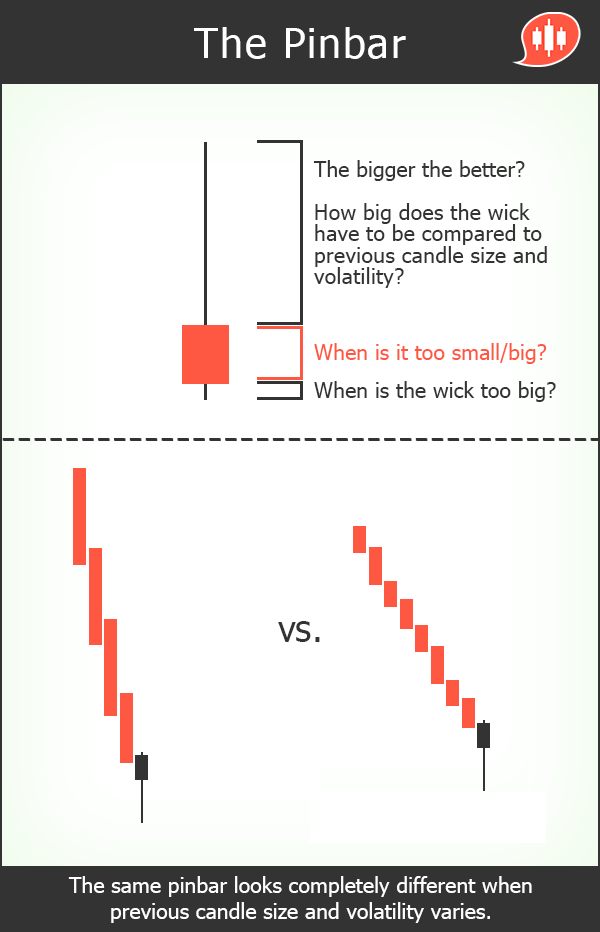
The pinbar is one of the most popular candlestick patterns, if not THE most popular one. Although the pinbar often stands out and is easy to spot in hindsight, the way it is being created can tell you a lot about trading psychology.
Candle formation: The pinbar is characterized by a long wick to one side and the body of the candle on the opposite side. The side of the body usually does not have a wick or just a small one.
Important concepts and features: A pinbar can occur after a long trend where it signals a reversal and you can also frequently see pinbars during trends where traders try to reverse the trend direction and then get rejected – such pinbars are trend continuation signals.
We mentioned it earlier, often you find engulfing bars with a long rejection wick which then looks like a very strong pinbar.
Meaning: The wick of a pinbar often represents the impatience of losing amateur traders. Amateurs often enter way too early because they try to predict price movements. The professionals know that and then reverse price fast which creates the long wicks on the pinbars.

external link:


We have been trading supply and demand strategies for over ten years, and they have stood the test of time remarkably well. Supply and demand is...

3 min read
Choosing the right trading journal is essential for traders wanting to analyze performance, refine strategies, and improve consistency. In this...

3 min read
“95% of all traders fail” is the most commonly used trading related statistic around the internet. But no research paper exists that proves this...