3 min read
A Year with "The Trading Mindwheel": Transforming Trading Through Psychology
The following is a guest post from Michael Lamothe.
I'm Michael Lamothe, and today marks an extraordinary milestone: the first anniversary of "The...
Technical analysis works and it has been around for decades and decades…you have probably heard such slogans and claims dozens of times but is that really true and why are so many traders failing using it?
Technical analysis is a good way when it comes to analyzing charts and timing trades but, at the same time, you have to make sure not to follow the same pitfalls like everyone else. Many traders read the same books, study the same websites and trade the exact same patterns in the same way – and then get the same results.
At one point, it becomes very obvious where the ‘average’ losing trader will enter his trade, where his stop goes and when he will move his stop to break even to ‘protect his position’ because they are all following the same advice.
In this article, we will go over the most common trading patterns and explain why and how the normal traders struggle and how you can use this knowledge to find better trades and hopefully be on the winning side of a trade more often.
Let’s start with the classic sideways range which is one of the most commonly traded patterns. The main problems with this pattern are:
The safest method trading the sideways range is it to wait for a confirmed breakout and then enter on the retest. The retest often has the goal to shakeout all the early breakout traders who have moved their stops too soon to break even.
For the rest of this article, always keep this concept in mind: where do all the amateurs enter based on the trading textbooks, how do they place a stop and when do they move their stop to break-even (and where is their break-even point).
If you are an aggressive trader, you can trade the initial retest – but you will run into more losses when the retest isn’t successful. Or you wait for the retest to be confirmed and then enter once price pulls away from the level – you enter a bit late on such an entry but with additional confirmation.
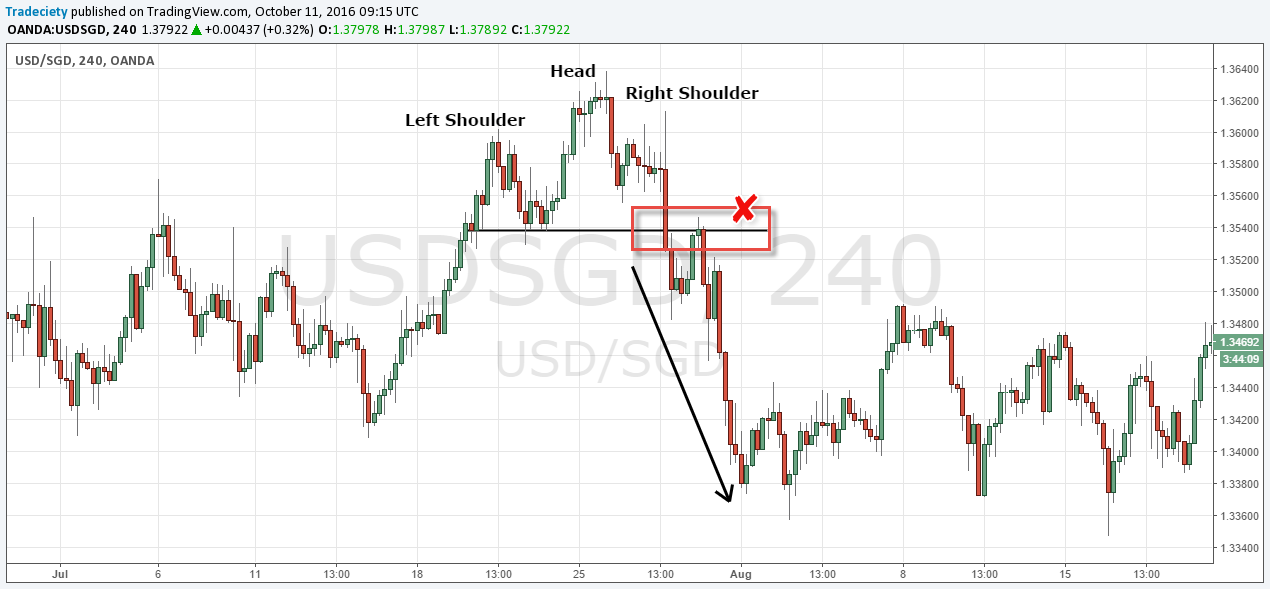
One of my favorite patterns is the Head and Shoulders because it looks so obvious but in reality it’s hard to trade. The reason being is that most traders will enter after the head has formed and then get squeezed out of their trade on the right shoulder. Or, they enter after the right shoulder has formed and then get squeezed or taken out after moving the stop to break-even on the retest of the neckline. Either way, this pattern is not as simple as it looks.
Similarly to the sideways range example, you wait for the successful retest of the neckline or, if you are more aggressive, you get in after the neckline has been broken and DON’T move your stop to break even before the retest has happened.
Moving a stop to break-even isn’t always bad, but if it happens in the wrong context, at the wrong time and with the wrong intentions, it will get you out of potentially profitable trades too soon before the real move happens.
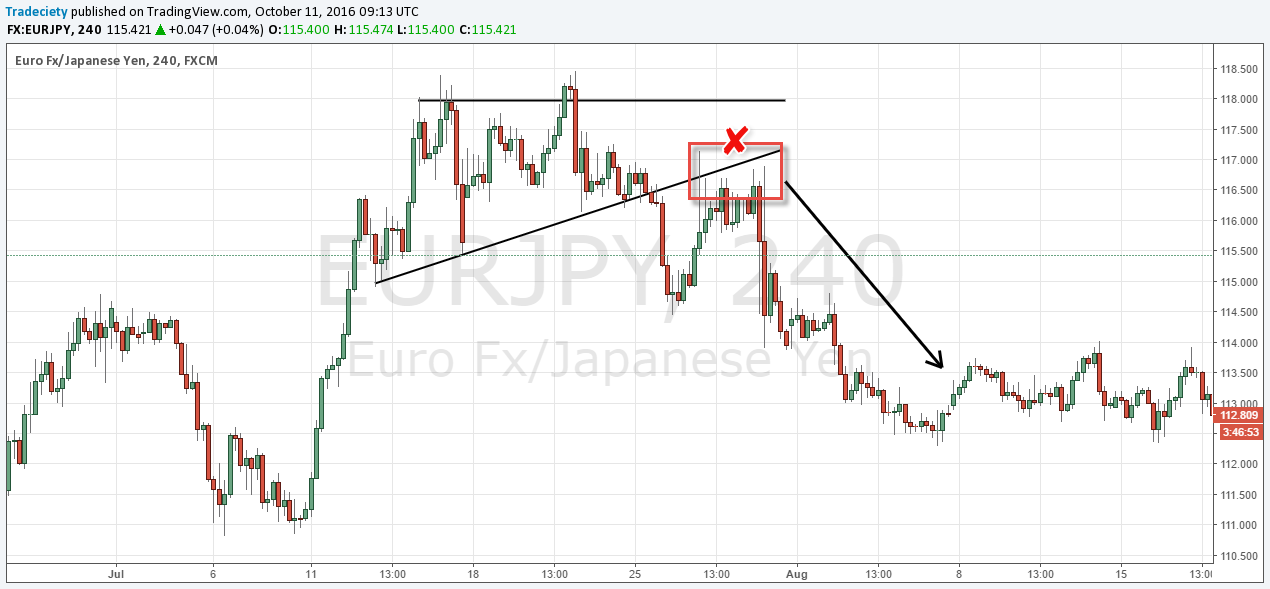
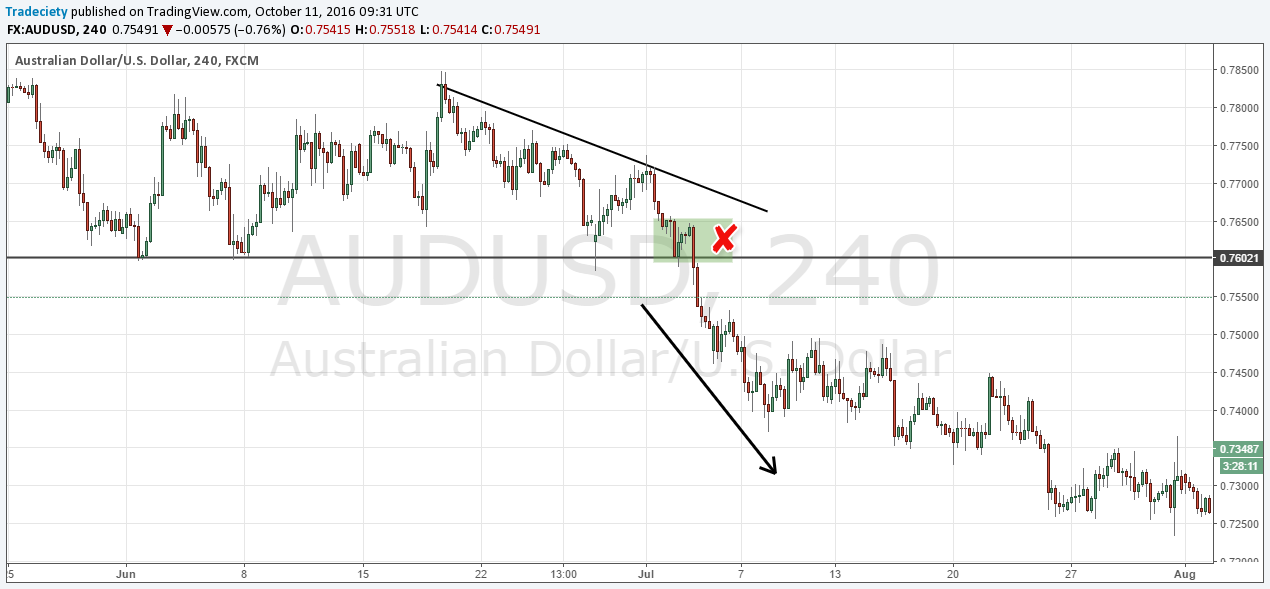
Another classic break and retest pattern is the trendline shift. It’s basically the same pattern as the sideways break and retest but this time around a trendline.
The screenshot below shows a classic example where price moved all the way back into the origin of the initial breakout. It even stayed there for a good amount of time and continuously pushed into the level, squeezing and shaking out all the weak hands or break-even stops.
Trendlines are a great trading tool and many traders follow the conventional approach of trading the initial breakout. The majority of those traders then moans about break-even stop hits on the retest. Thus, I highly recommend that you start viewing charts from a different perspective and you try to understand where the ‘regular’ trader has entered and where he has his stop during his trade and then use this knowledge to position yourself accordingly.
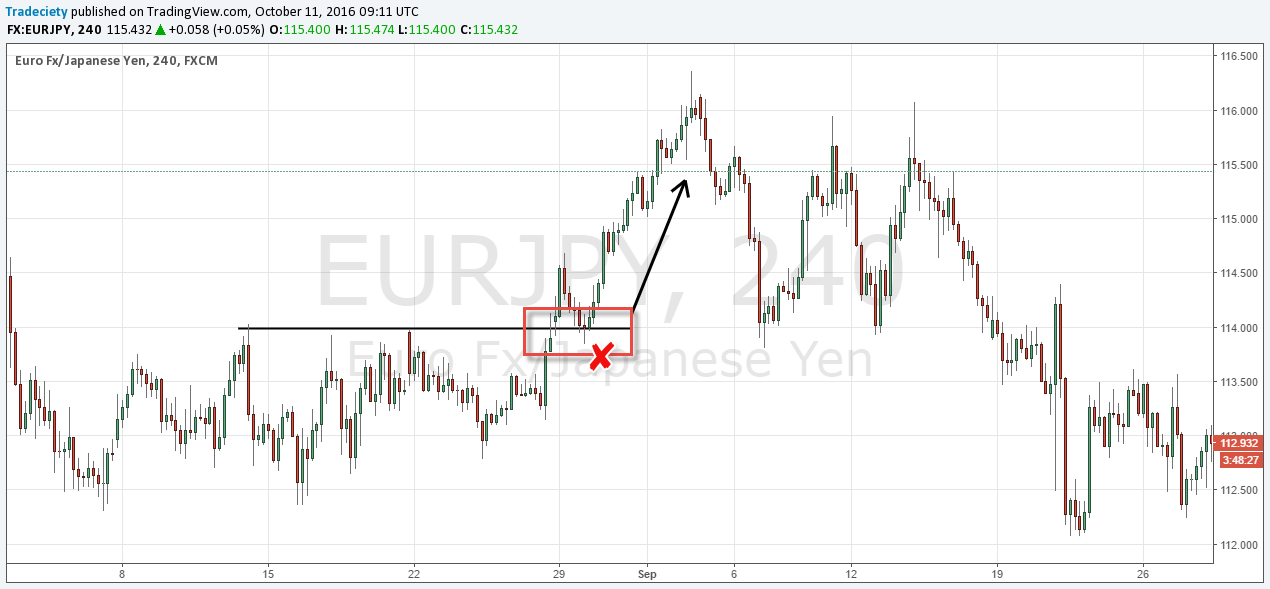
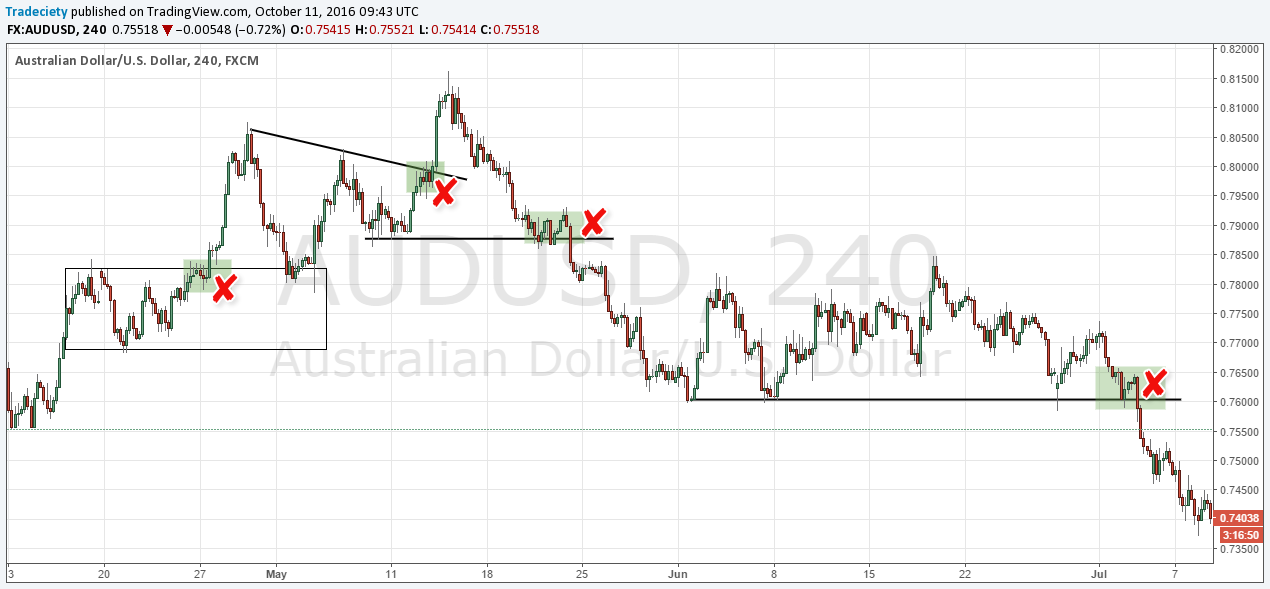
The range trap pattern usually leads into runaway trends where no retest happens and price just takes off.
The trap is the little green marked box just before the breakout and once this pattern occurs, it will look (without the benefit of hindsight) like price is once again moving higher, staying in the range and respecting the support level.
The trap usually happens in ranges where the boundaries are very obvious and many traders will have such a range level on their charts. Again, conventional trading knowledge tells traders to wait for at least 2/3 touchpoints until such a level is confirmed. The trap is often the 3rd or 4th touchpoint when the level is the most obvious and when the amateurs believe that they have found a good range. Ever wondered why the textbook patterns rarely work? It’s for that exact reason.
Such traps are a common pattern around key support and resistance areas and they don’t only happen around horizontal ranges, but you can also find them at trendlines.
The most important thing is that you don’t automatically fade every 3rd or 4th support touch but you have to wait for such a pattern to occur and then wait more for the actual break. When all the traders believe that ‘this super obvious support level/trendline is going to hold again’, this is the time when you should become interested and wait for the squeeze.
Once again, it pays off to know how 99% of the traders trade around a level and then use this knowledge to your advantage. Those patterns require a lot of patience and you have to avoid taking trades where the setup is ‘almost ready’.
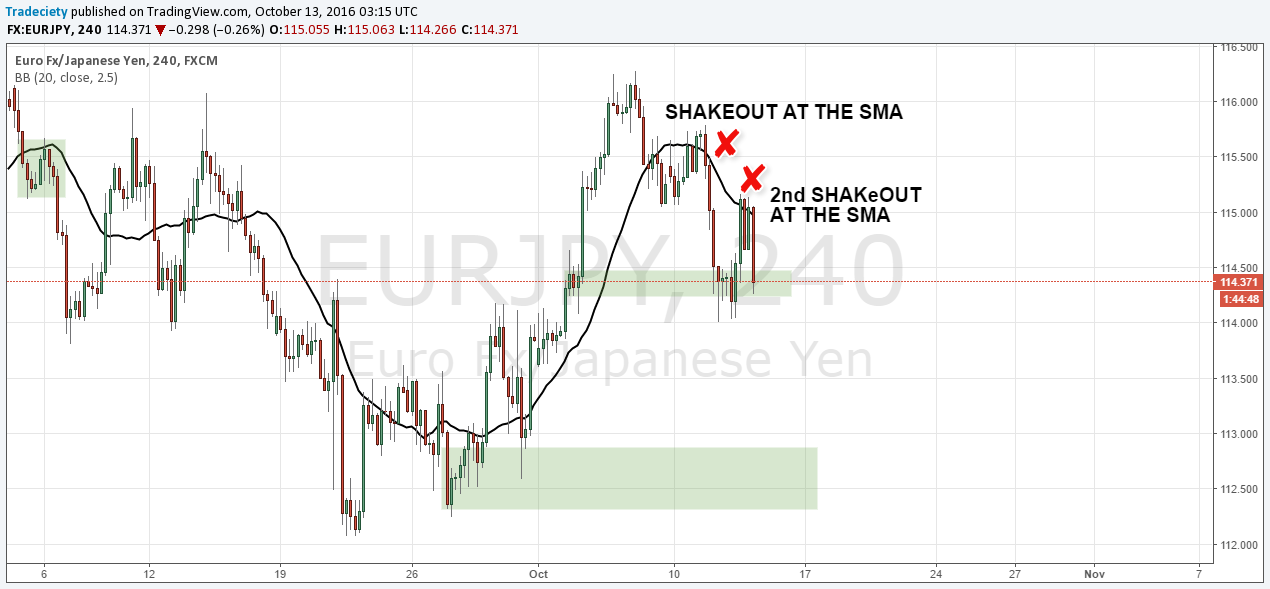
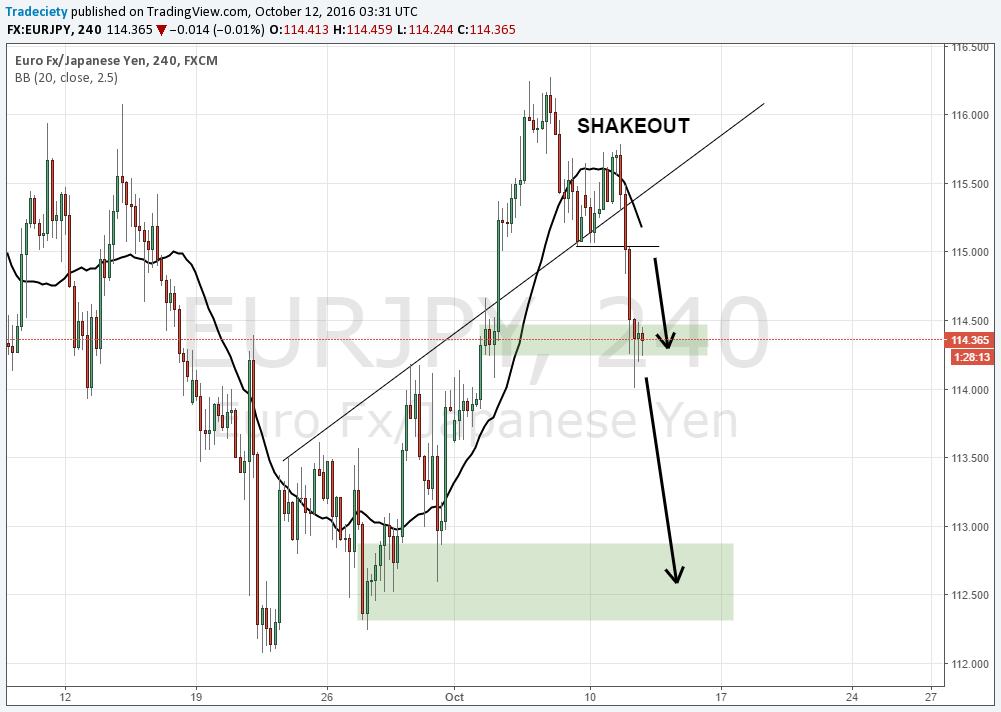
In our reversal trading, we use the 20 SMA; moving averages are a commonly used tool overall. That’s why you can often see the squeeze pattern around moving averages as well and a break and retest pattern at moving averages is a well-known pattern.
The price behavior follows the same patterns: after a market has topped (or bottomed), many traders will enter a trade once the moving average has been broken. Once price has pulled away just a little bit, traders move their stops to break-even and are then taken out on the retest.
Furthermore, many traders use moving averages to trial their stop along the way and that’s why you can often see retests that violate the moving averages during a trend. For that reason, we always suggest using ‘padding’ and don’t recommend placing the stop right at the moving average.
I hope that with the help of this article, you can start looking at the general patterns in a new way and also ‘get into the head of the other trades’ to understand who is on the other side of your trade, how weak hands approach the market and how to use it to your advantage.


external link:
external link:

3 min read
The following is a guest post from Michael Lamothe.
I'm Michael Lamothe, and today marks an extraordinary milestone: the first anniversary of "The...
3 min read
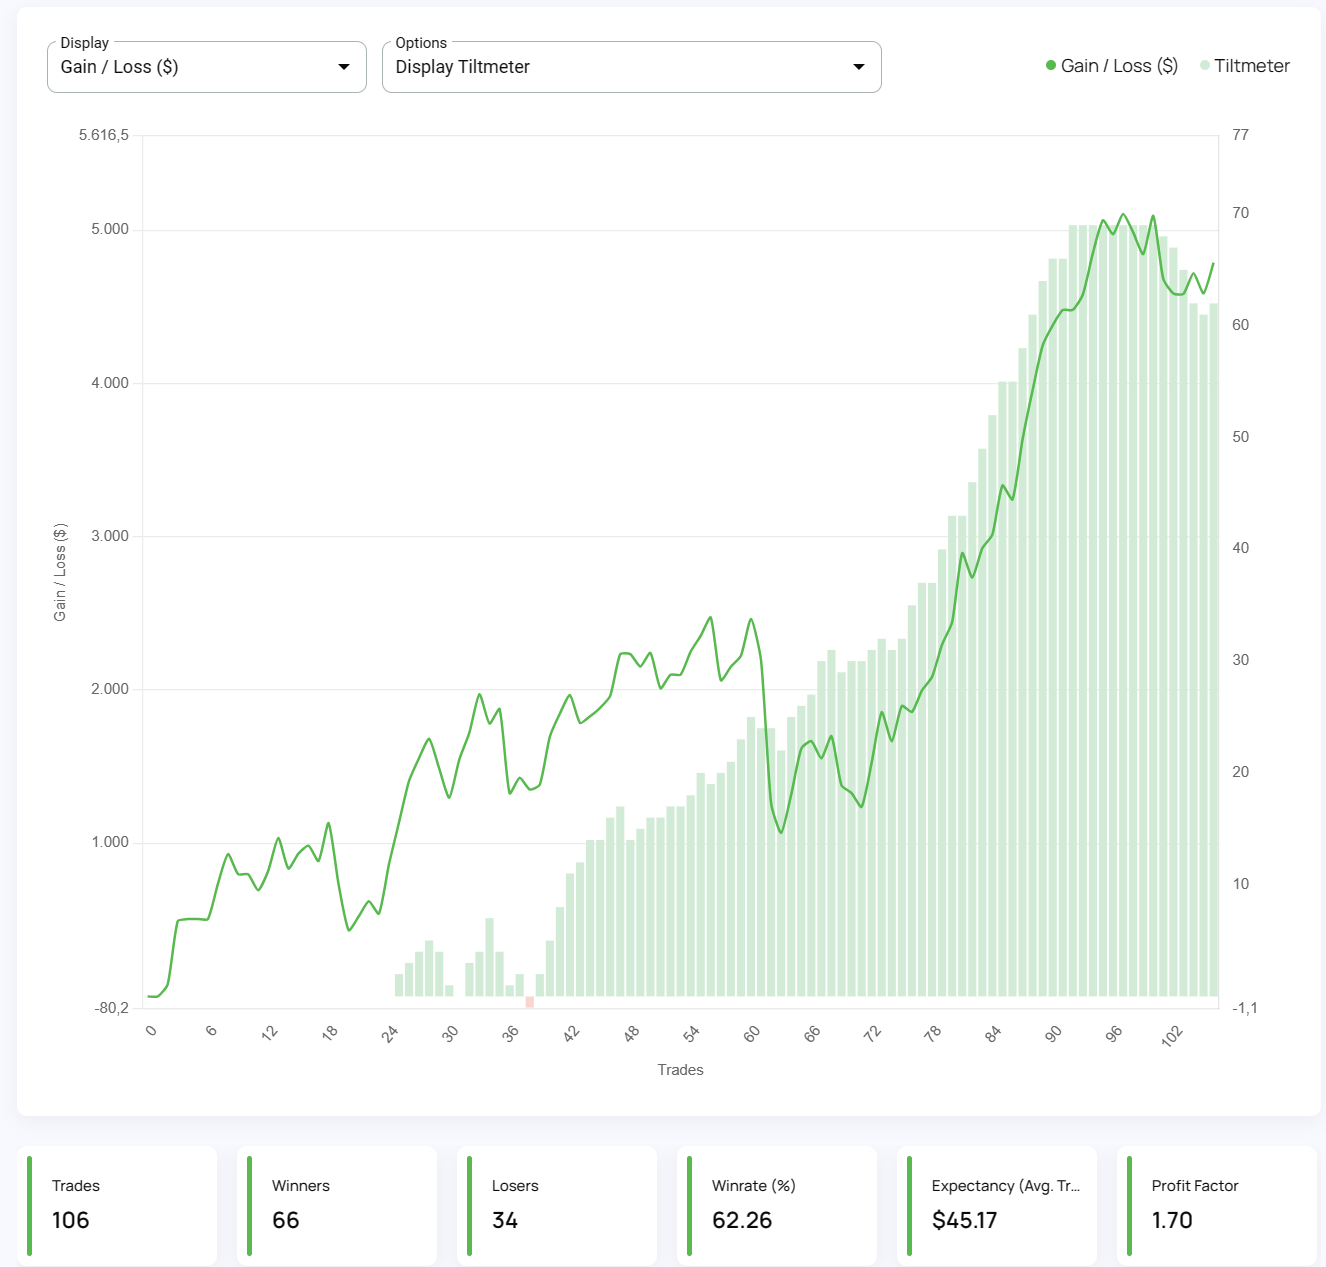
It's easy to get discouraged by losses and question your every move. But what if there was a way to track your progress, learn from mistakes, and...

8 min read
Dive deep into the world of finance and high-stakes trading with this selection of movies and documentaries! From the exhilarating thrill of...