Supply and Demand Trading in 2026
We have been trading supply and demand strategies for over ten years, and they have stood the test of time remarkably well. Supply and demand is...
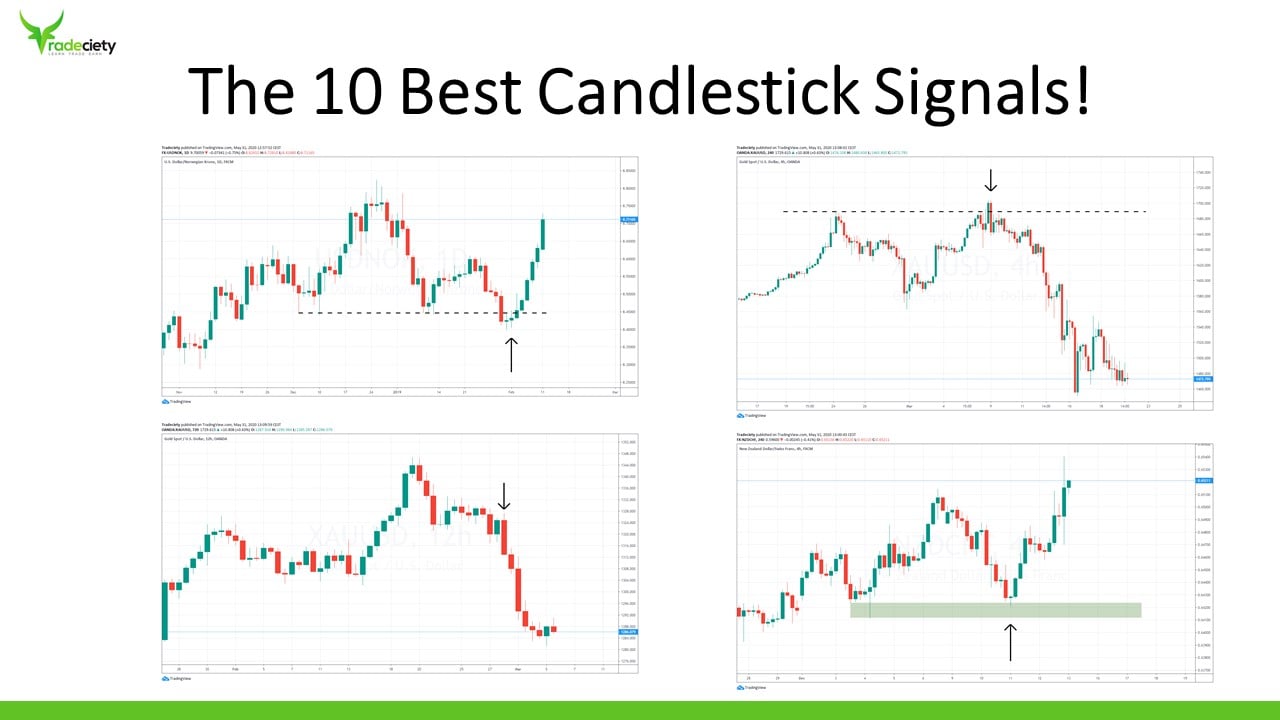
In this article, we are going to discuss the 10 best candlestick signals.
Candlesticks are very important because they are the representation of the interaction between the buyers and the sellers on financial markets.
Candlesticks are way more than what most people think and we are going to take a look beyond the surface level, trying to understand what the psychology behind the price action is telling us.
Location matters!
Although candlesticks can be powerful signals, they offer the most value when combined with other trading concepts.
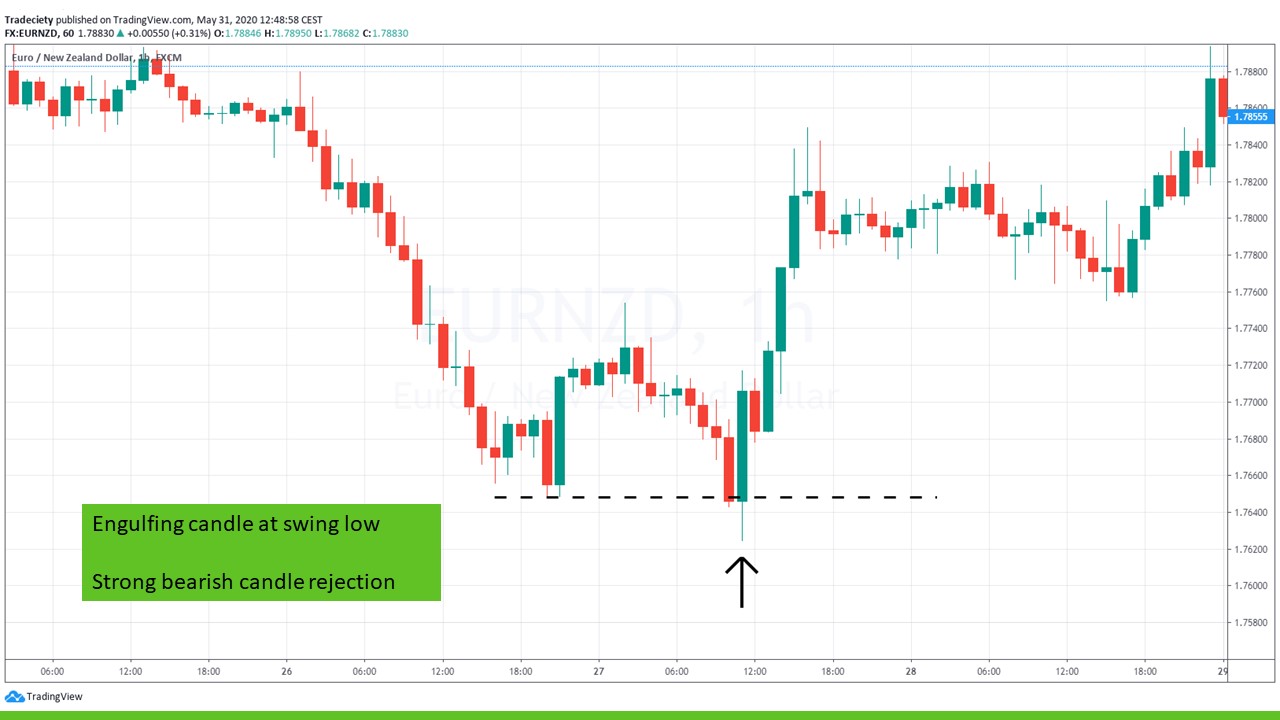
In the scenario below, we see a strong bullish engulfing candle at a previous swing low.
The price was in a strong downtrend before the engulfing candle. But the failed breakout below the last swing and the immediate reversal with the engulfing candle shows that the sellers are not controlling the market anymore.
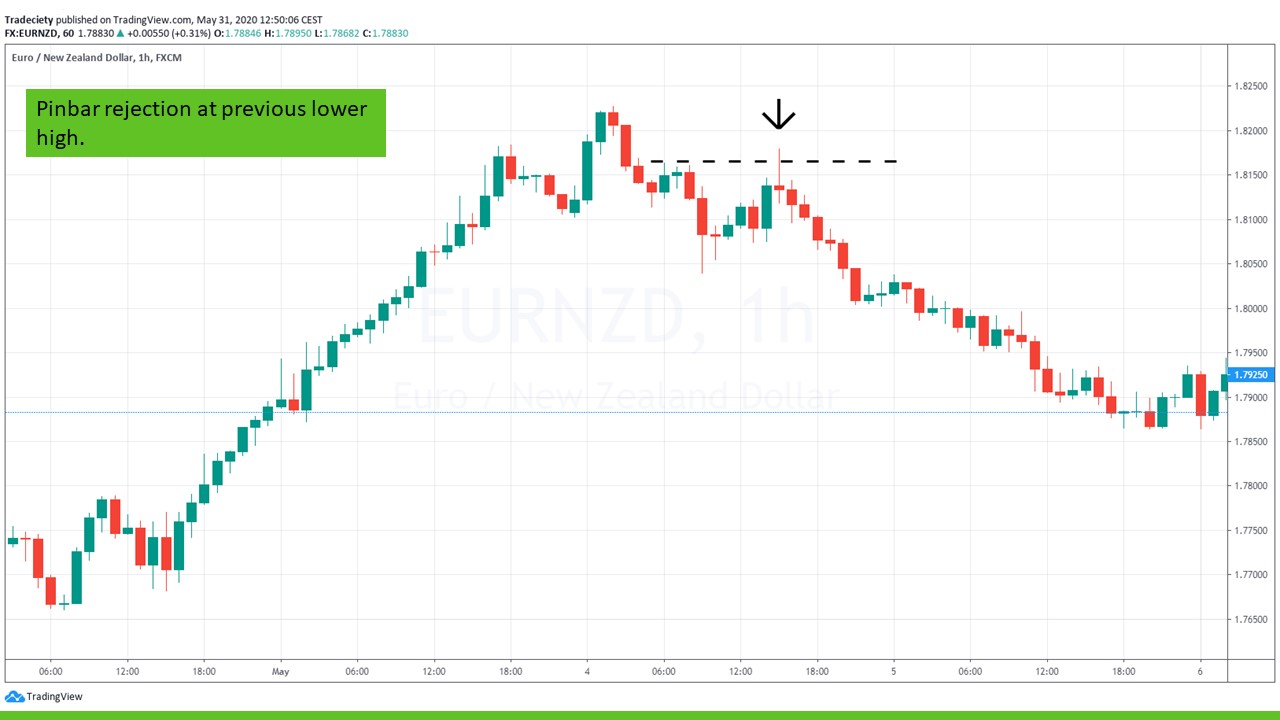
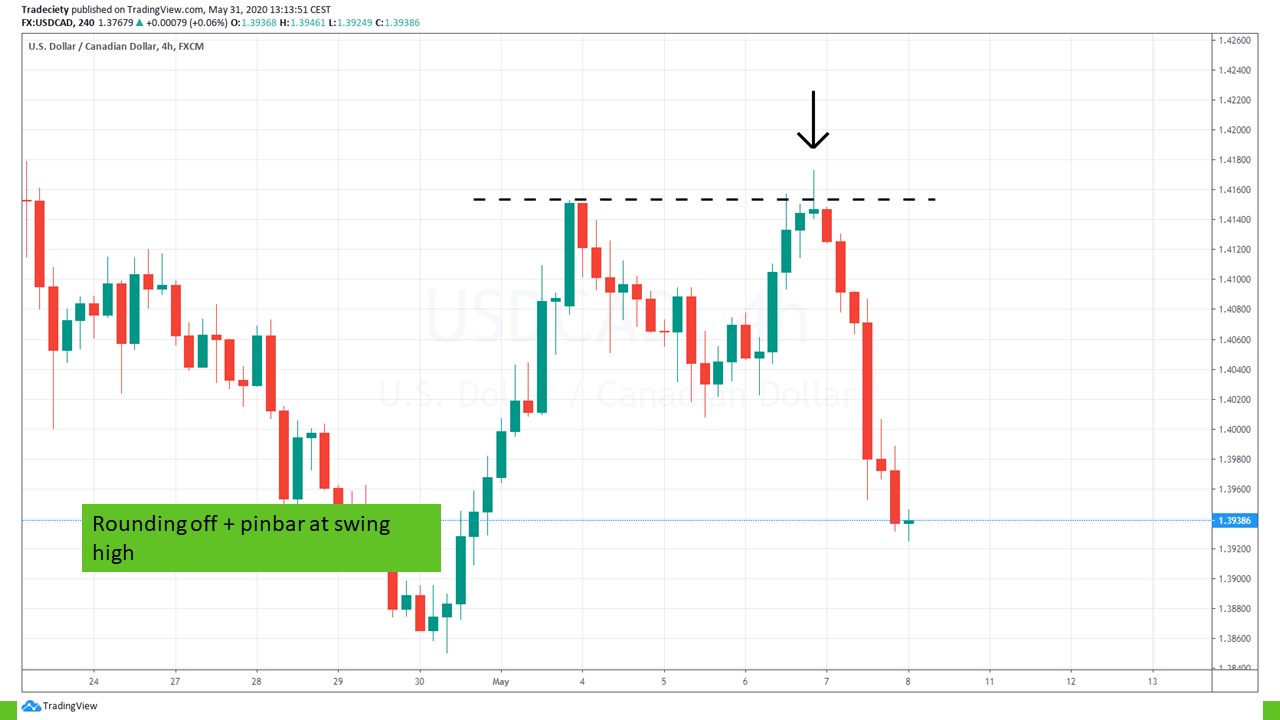
The scenario below shows a pinbar rejection after a trend change.
Prior to the pinbar, the uptrend has already turned. Whereas previously, the price made higher highs and higher lows, the pinbar marks the second lower high. Such a shift in trend sentiment is already a strong bearish signal. But when the lower high occurs with a pinbar rejection, the bearish signals is reinforced.
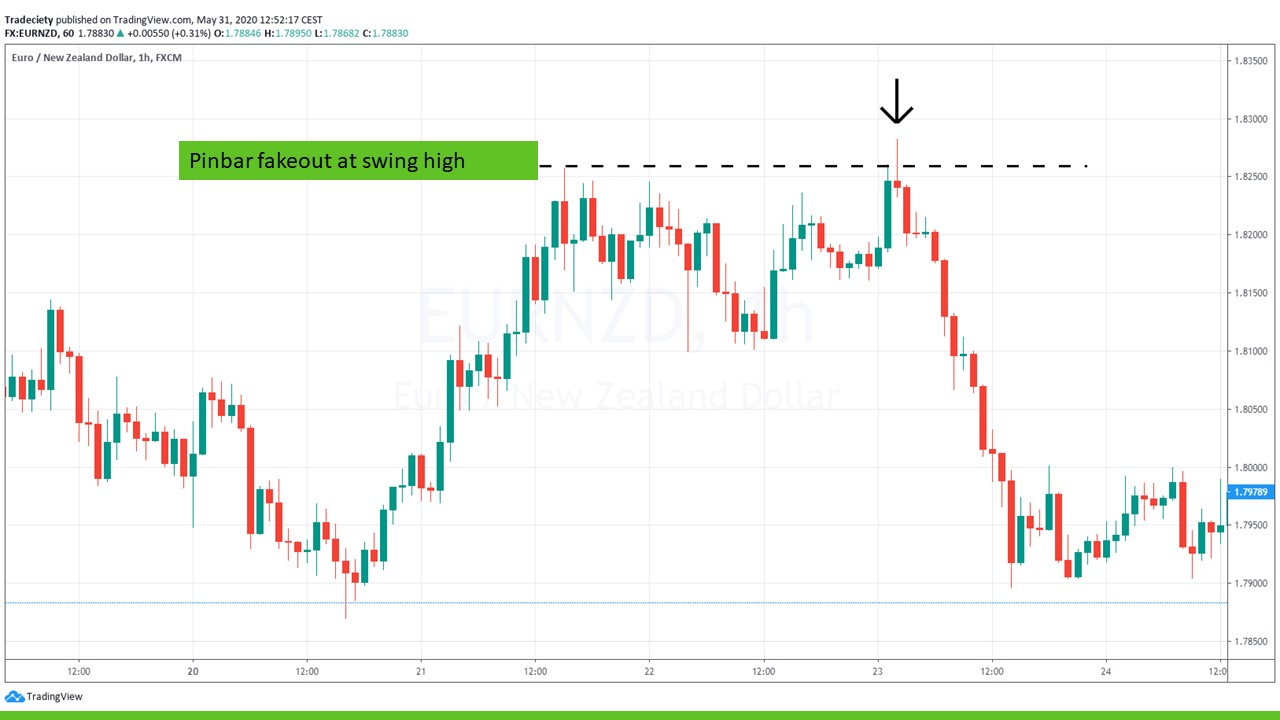
Fakeouts are among the best candlestick signals in price action analysis. The fakeout in the scenario happened right at a previous resistance level.
The pinbar fakeout shows that the price tried to initiate a bullish trend continuation but the bulls didn’t have the majority anymore.
Fakeouts often happen as stop hunting mechanisms at key price areas. It is, therefore, helpful to put yourself in the shoes of the average retail trader to get an idea of stop loss placement. A fakeout with a failed breakout often leads to a complete reversal when traders are trapped in a bull trap.
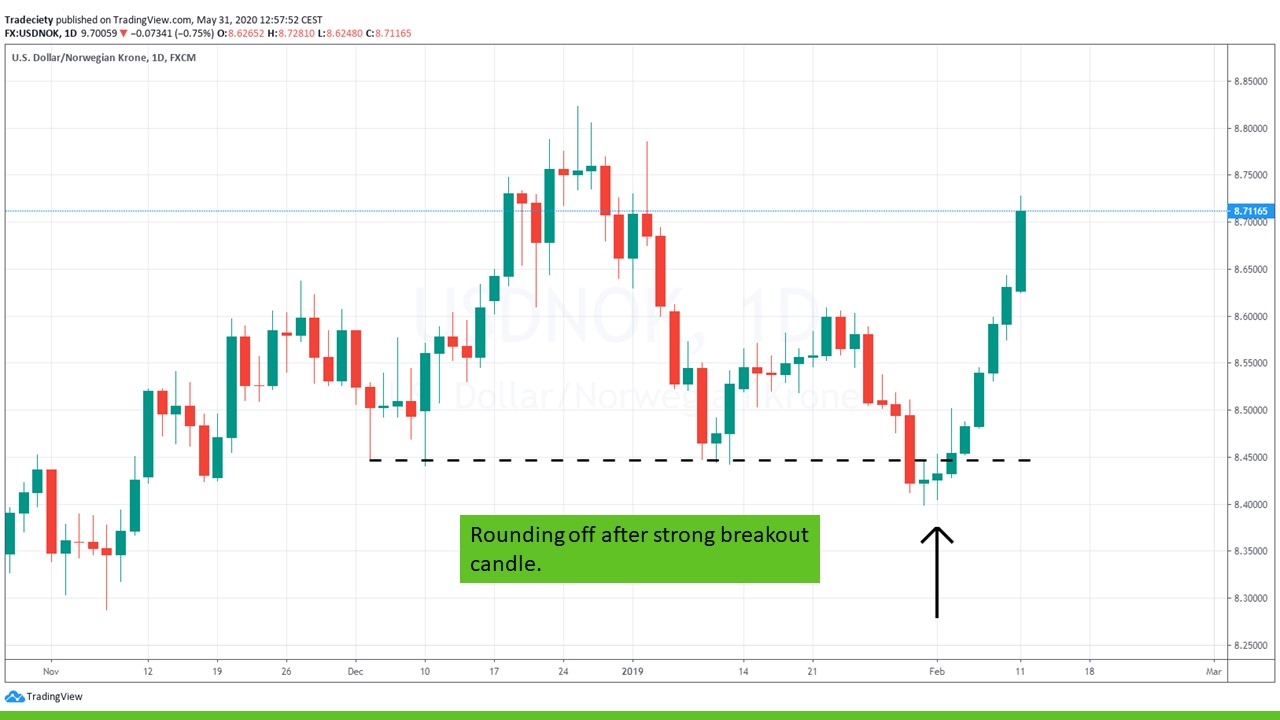
The scenario shows how multiple candlestick signals come together and help us form sophisticated price analyses.
First, the price traded into an already established support level (dotted line).
Second, the price tried to break out with a large bearish candle. However, there was no follow-through and as a breakout trader, you’d expect more bearish follow-up momentum after such a strong breakout.
Third, the two candles after the large breakout resemble neutral Doji candles. This shows indecision in the market.
Finally, the bullish candles accelerate away from the failed breakout. This concept of deceleration and acceleration often occurs at turning points. A new bullish trend formed as the acceleration continued.
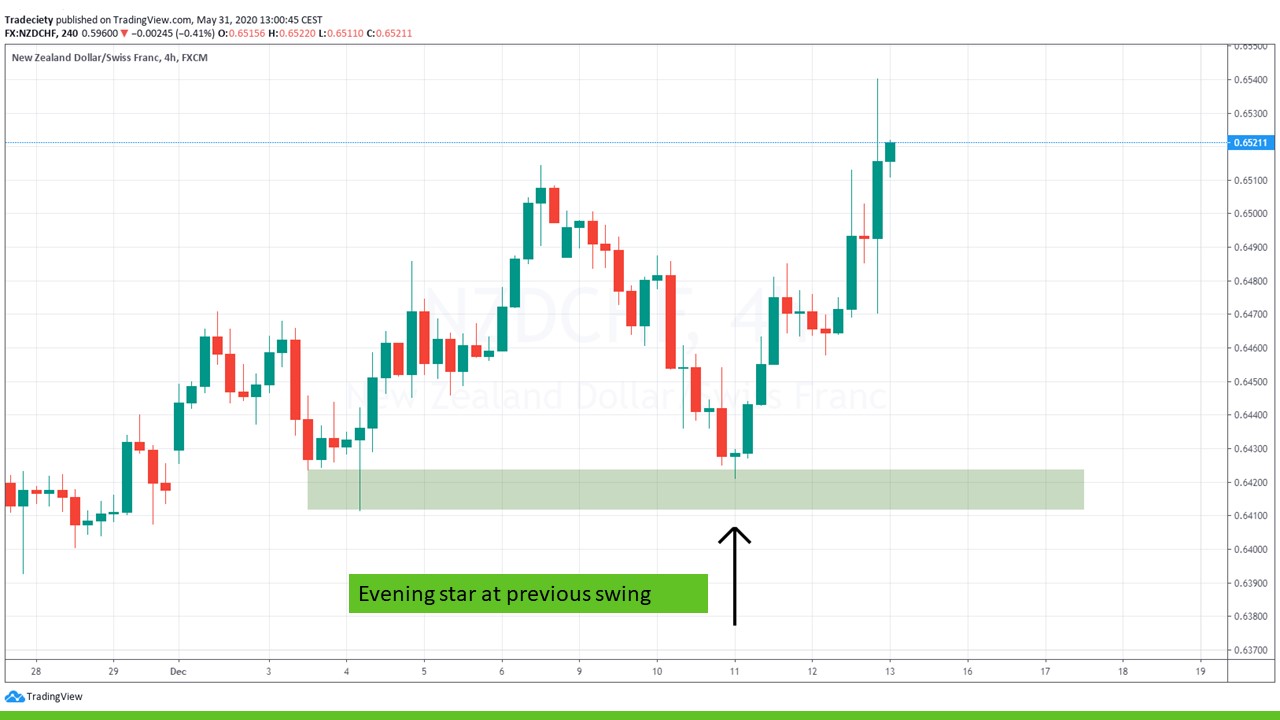
The next scenario shows another example of deceleration and acceleration at a key support level.
This 3-candle sequence is among the best candlestick signals that exist.
The price first accelerated into the green support zone. The large bearish candle arrived at the previous low.
The next candle was a neutral Doji candle.
The third candle then formed as a strong bullish candle, rejecting the support level.
Although this pattern is among the best price action patterns there is, you must make sure to only trade it with confluence. Trading those patterns at key support/resistance, supply/demand areas and after trending markets may increase your odds significantly.
Always follow the story that the price is trying to tell you.
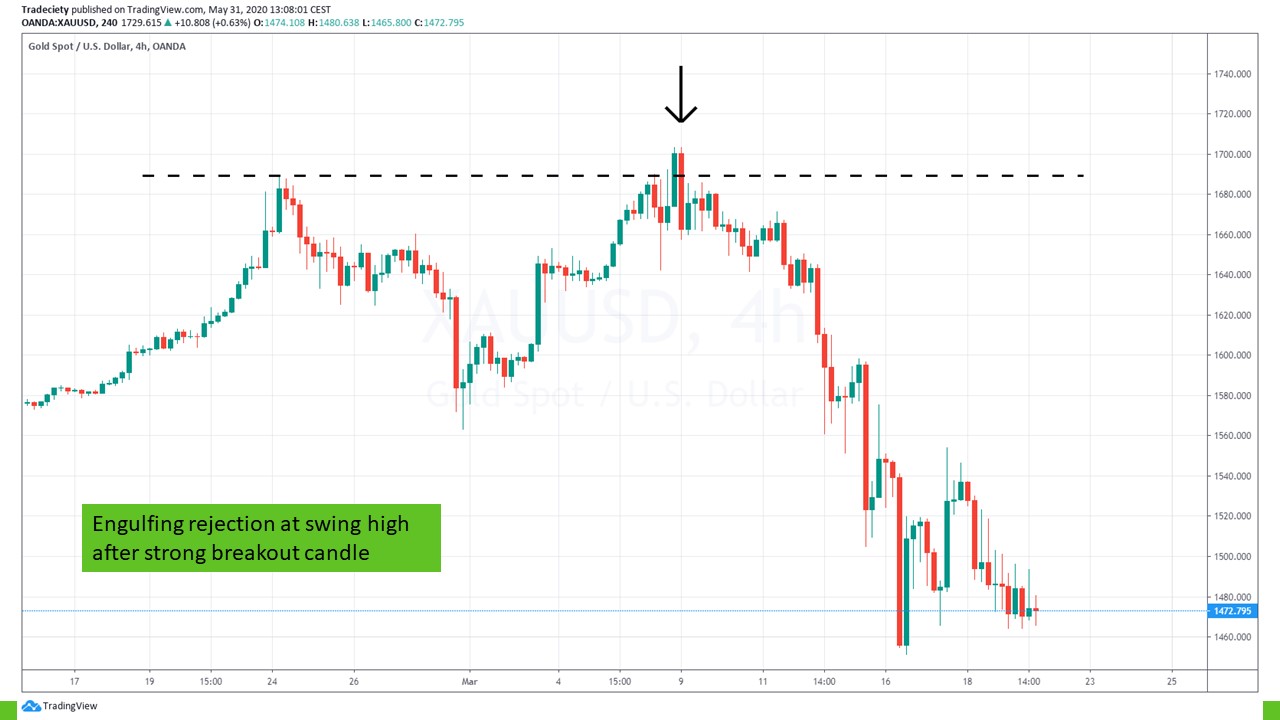
Failed breakouts that come with a candlestick pattern can be great trading opportunities.
In the scenario below, the price tried to break above the previous highs but was rejected immediately within the next candle. The rejection candle is so large that it completely engulfed the bullish breakout candle.
Strong breakout candles make it look like the price is finally ready to continue the previous trend. But often, such strong candles just try to lure in traders. When the failed breakout then becomes obvious, amateurs hang on to their position too long and can’t cut their losses.
An engulfing candle can also act as a trend continuation signal.
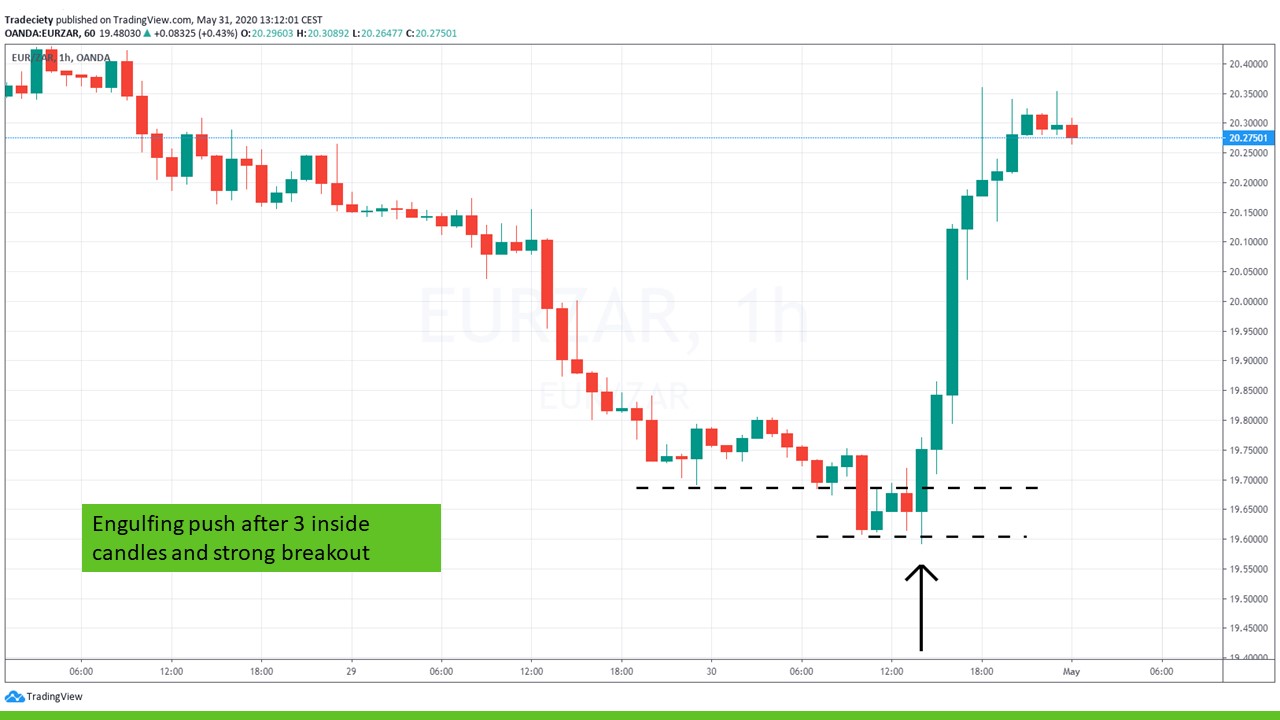
In the scenario below, the price already started a new bearish trend. The engulfing candle breakout marked the end of the first consolidation and led to a trend continuation.
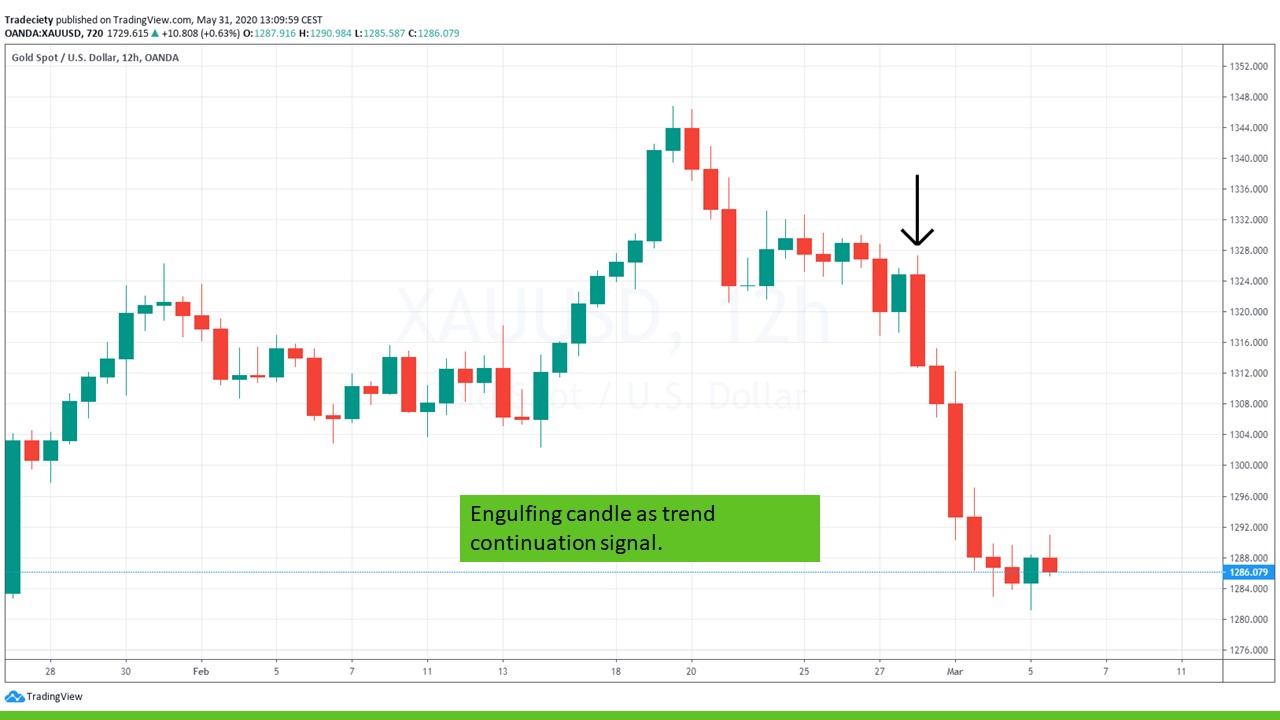
On the left, the price was in a strong downtrend.
The first dotted line marks a lower low and a trend continuation. But from the first to the second dotted line, the price as just barely able to break lower. Such short trend continuations are very important signals and they indicate a lack of trend support.
The price just traded sideways by forming small inside bars at the bottom. By then, it wasn’t clear that the downtrend would be over and we do not predict that the trend will reverse.
The engulfing candle is the final piece to the puzzle and it marks the rejection of the downtrend. The engulfing candle is the strongest candle that was formed by that point on the whole chart snapshot.
The scenario below shows another fakeout at a previous high.
The fakeout happened as a pinbar. Furthermore, the concept of deceleration and acceleration can also be observed around the pinbar and show the gradual change from bullish to bearish market.
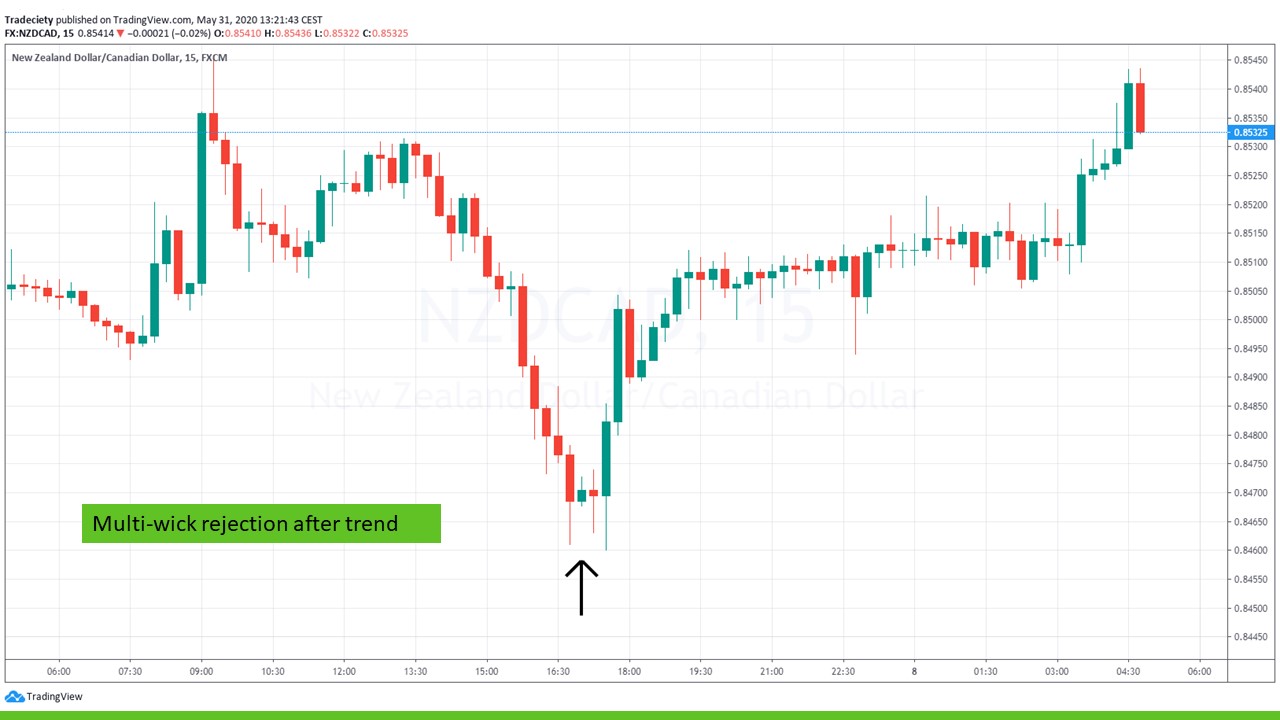
Multi-wick rejections are great candlestick signals because they give traders a lot of time to notice the chart.
The strong bearish downtrend came to a sudden end when two neutral Dojis formed after a strong bearish candle.
After the second Doji, the price shot higher and formed an engulfing candle. The engulfing candle is the signal that a new bullish trend is forming.
I hope that you gained some insights into candlestick trading. I’d recommend picking a few candlestick formations that you want to master and then start tracking them on your charts. Don’t overwhelm yourself by trying to trade all candlestick patterns and just follow on the best ones.
Furthermore, combine single candlestick signals with other confluence factors such as support/resistance, supply/demand and trend analysis.
Further reading: The ultimate candlestick guide

external link:


We have been trading supply and demand strategies for over ten years, and they have stood the test of time remarkably well. Supply and demand is...

3 min read
Choosing the right trading journal is essential for traders wanting to analyze performance, refine strategies, and improve consistency. In this...

3 min read
“95% of all traders fail” is the most commonly used trading related statistic around the internet. But no research paper exists that proves this...