3 min read
A Year with "The Trading Mindwheel": Transforming Trading Through Psychology
The following is a guest post from Michael Lamothe.
I'm Michael Lamothe, and today marks an extraordinary milestone: the first anniversary of "The...
Trading isn’t that complicated but when I look at how other traders try to analyze their charts, I see a lot of misunderstandings. In this article, I want to provide a different and more simplistic way of getting to know price action charts and trading tools.
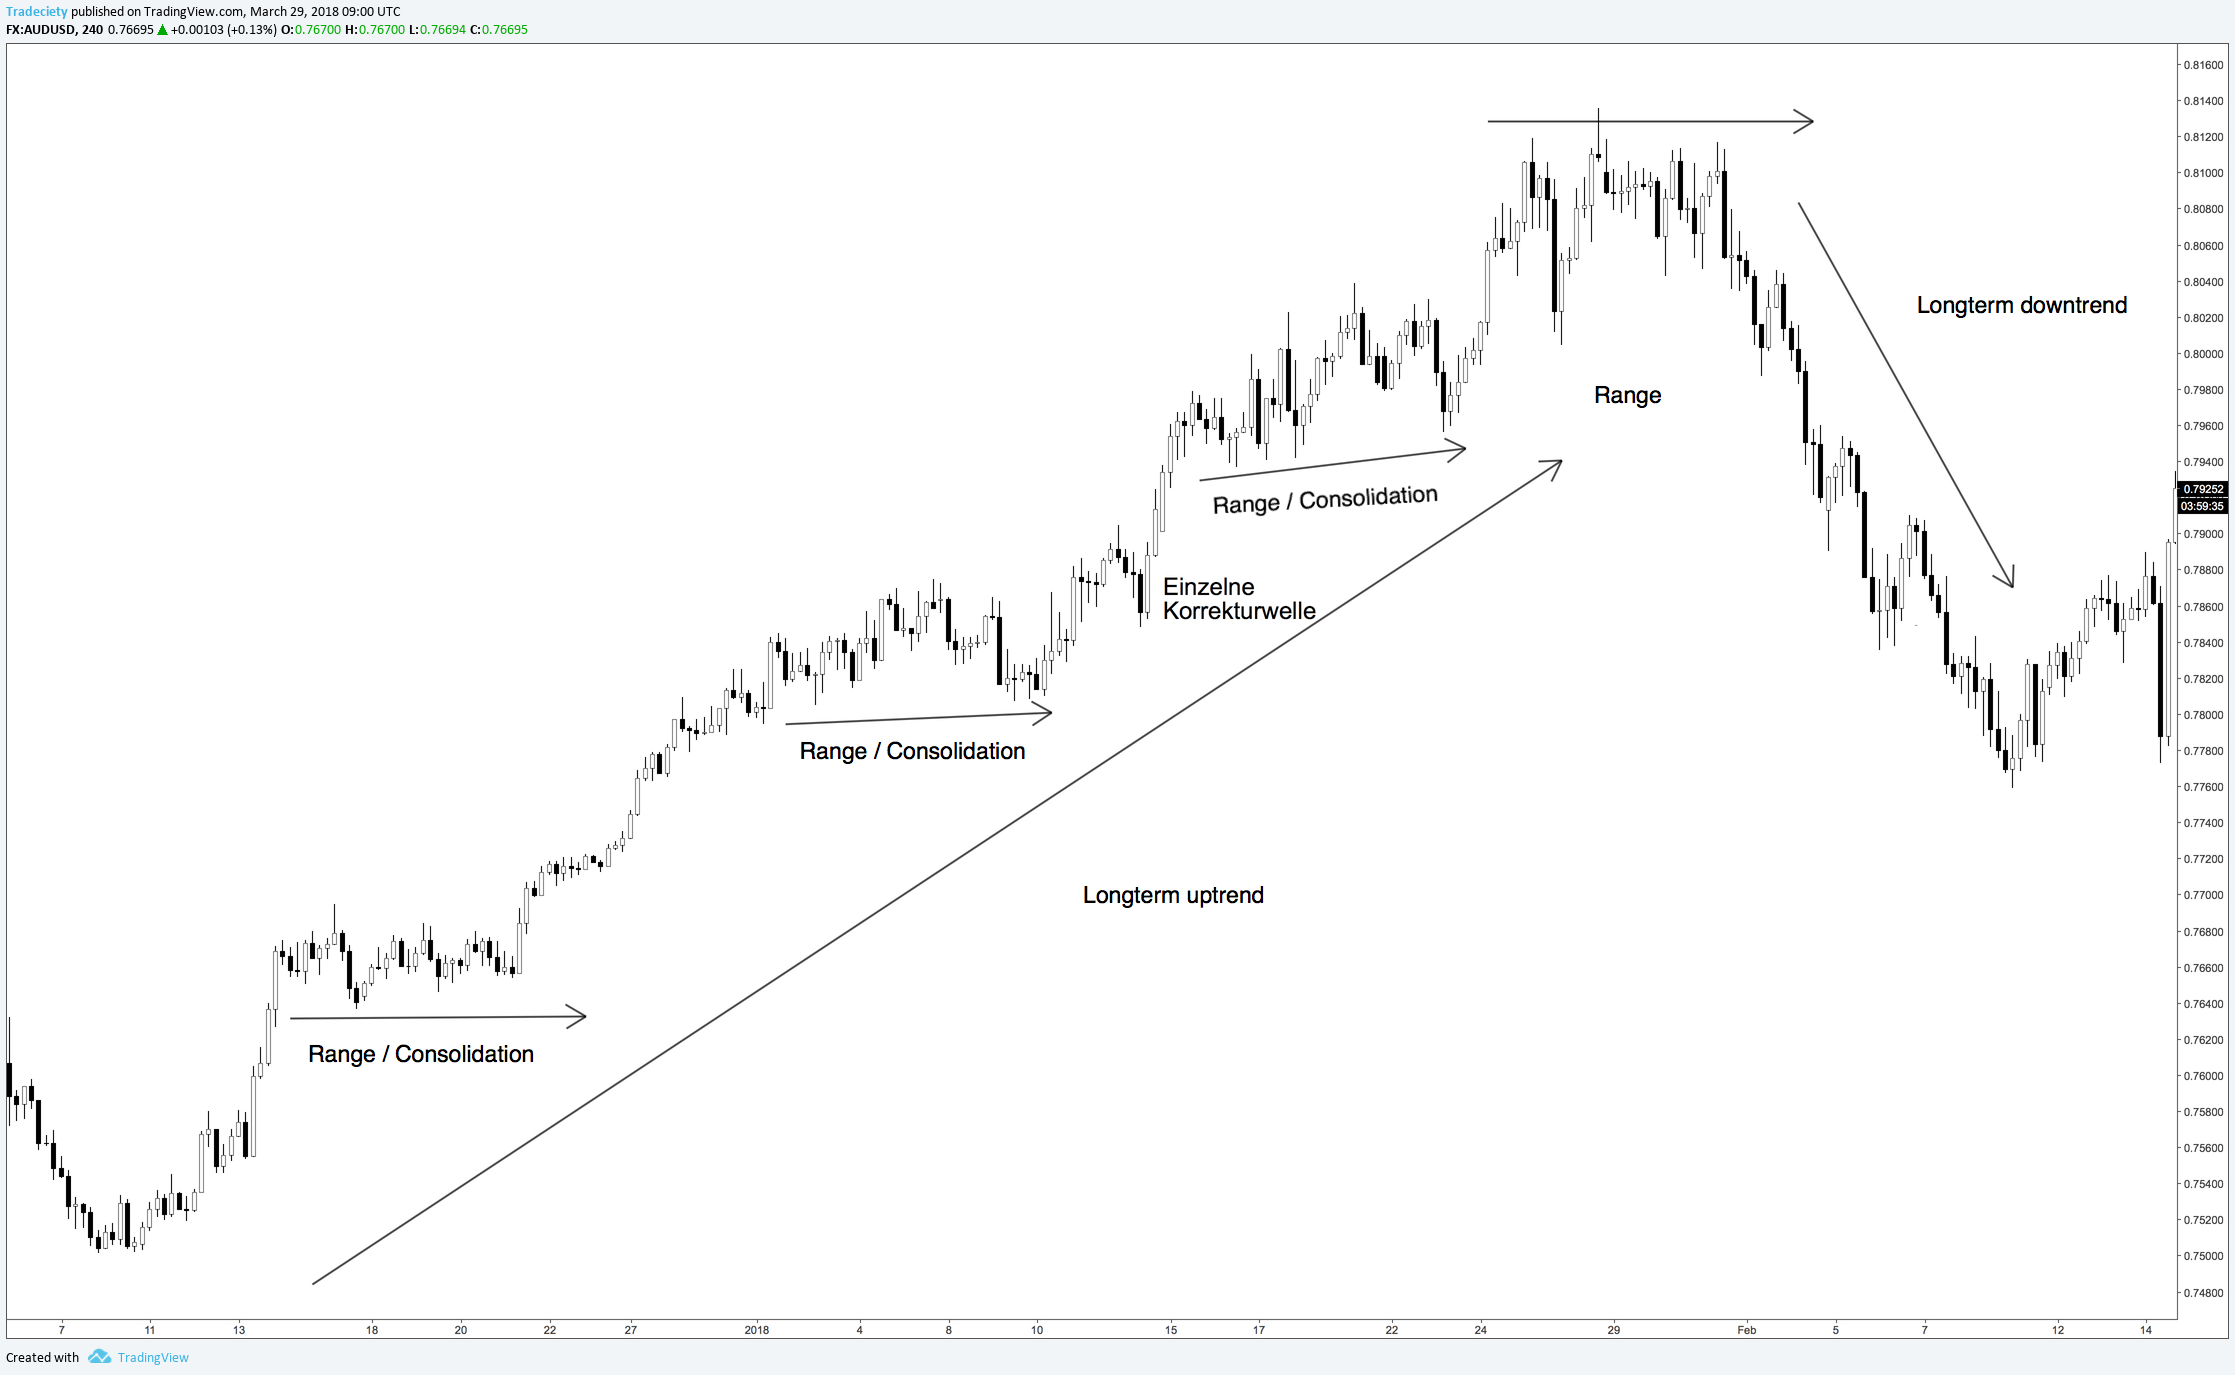
At any point in time, the market can only do one of three things: it can rise, it can fall or the price can move sideways.
The picture below illustrates the three market scenarios and it’s the perfect starting point for any price analysis. On the left we see a longterm uptrend and within the trend period, we see shortlived ranges. At the top, we see a final range before price turns lower and starts a new longer-term downtrend.
Of course, the length and the sequence of the different phases can vary but there is nothing else that price can do which is why it’s a great starting point for any technical analysis.
You can pull up any price chart for any period or timeframe and you will be able to see that all charts can be described just using those three market scenarios.
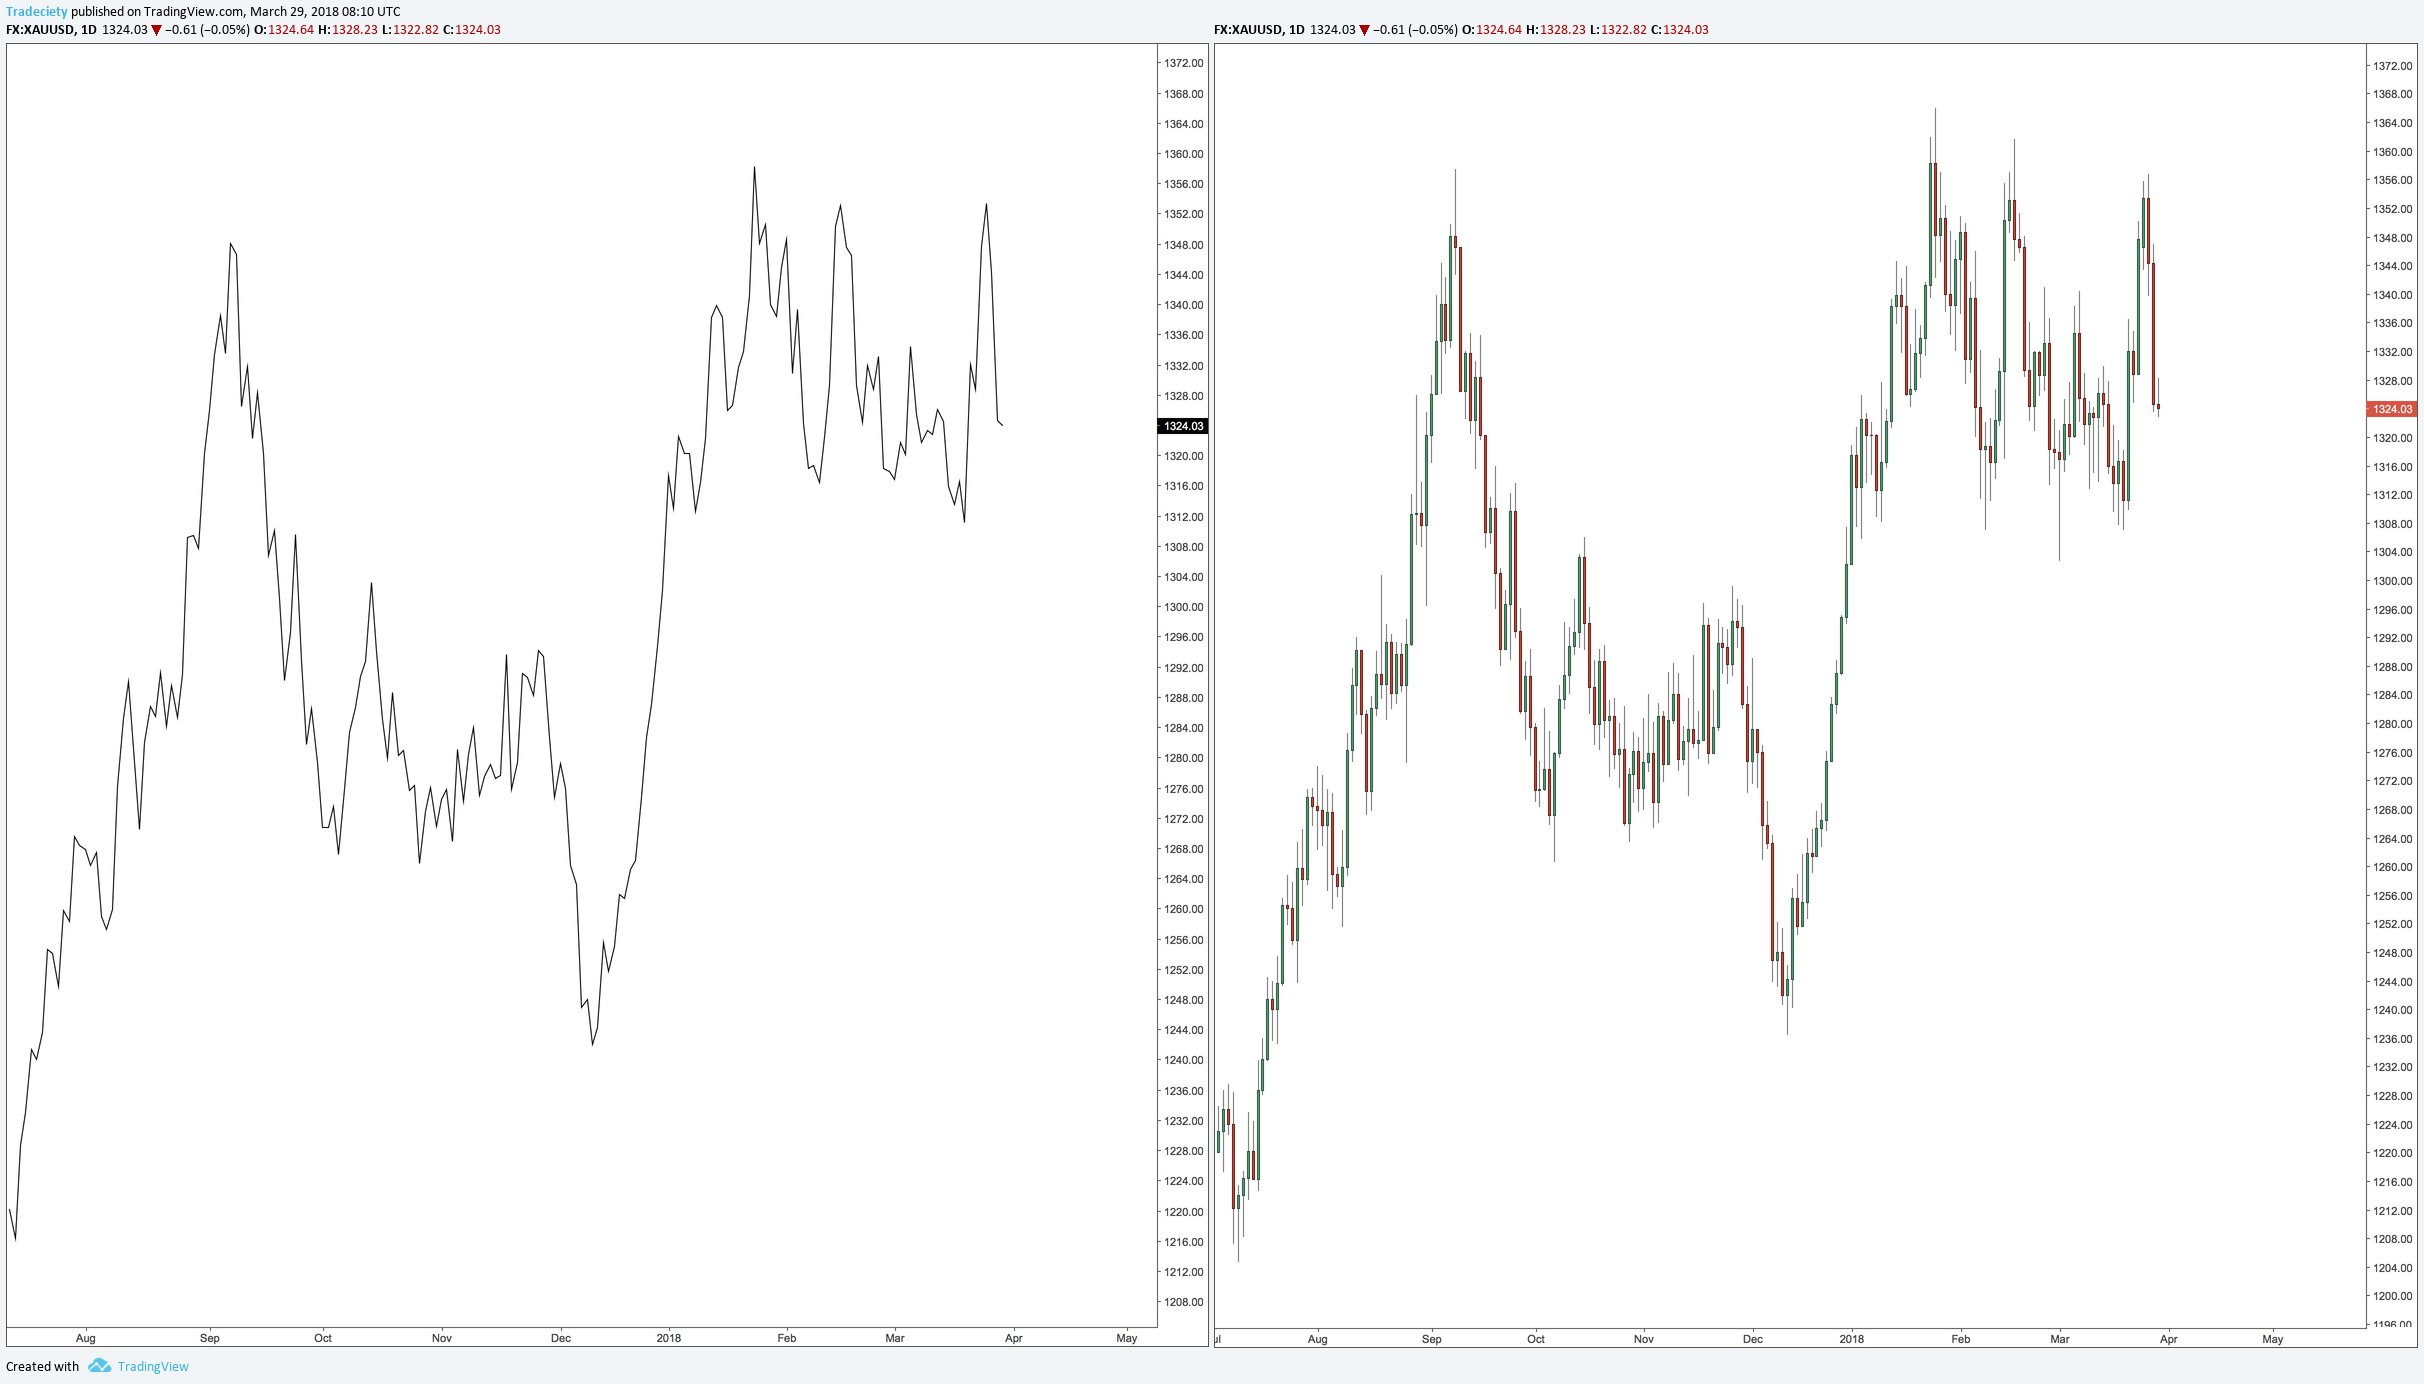
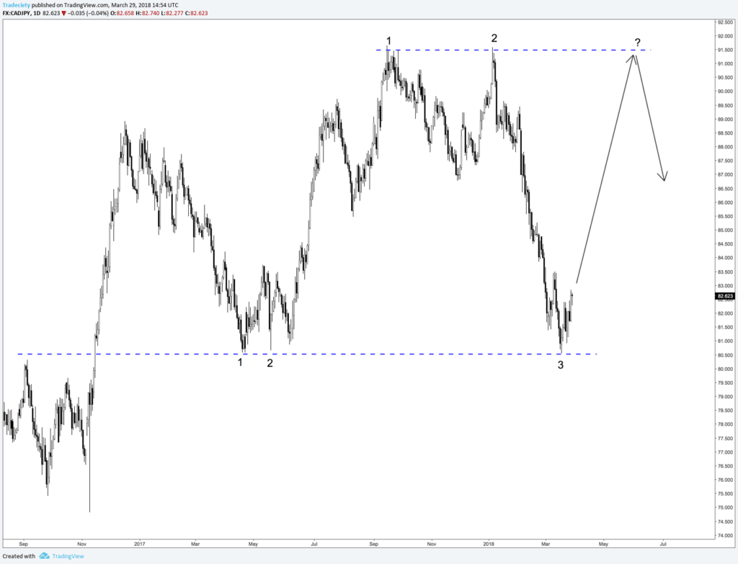
The most basic way when it comes to identifying the general direction on your charts is through analyzing highs and lows of the price.
Although it might sound simplistic, even the Dow Theory, which has been validated for decades, is based on this principle. And as we all know, an uptrend is described by higher highs and higher lows. When price then fails to continue this sequence and starts making lower lows (second x in the screenshot below) and lower highs, a new downtrend is beginning.
I highly recommend that you pull up a few different price charts – those can also be line charts as they are perfect tools for testing and learning purposes – and then start exploring how different highs and lows structures shape your charts. You can learn A LOT from observing the price structure this way and you will quickly realize how valuable this is.
Ask yourself the following questions when looking at such a chart:
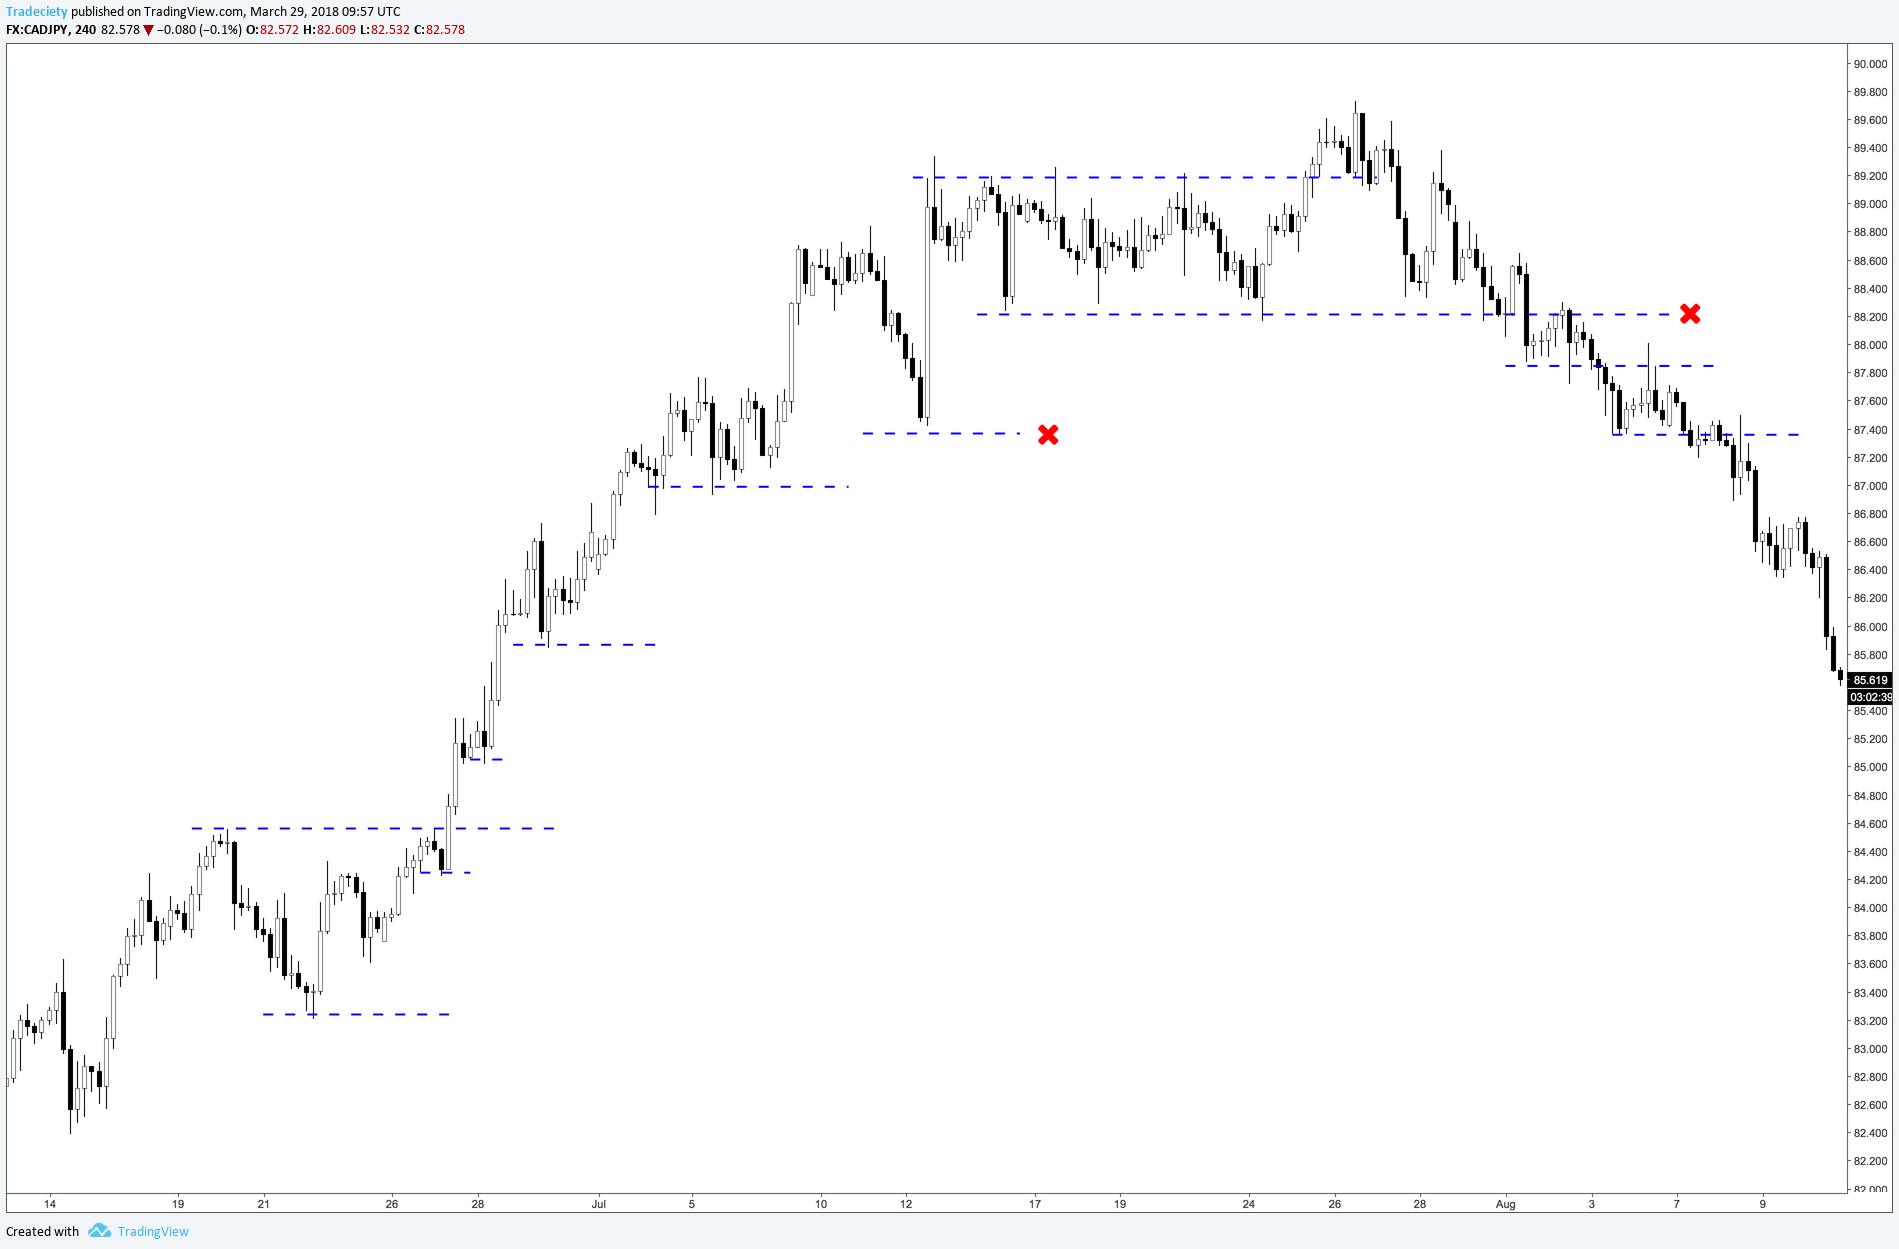
Support and resistance are among the most used concepts by all sorts of traders and even the media often picks up when a financial instrument approaches a famous support or resistance level.
Support = A price level where price ‘found support’ and went higher after reaching the support level.
Resistance = A price level that makes price bounce back lower after reaching it.
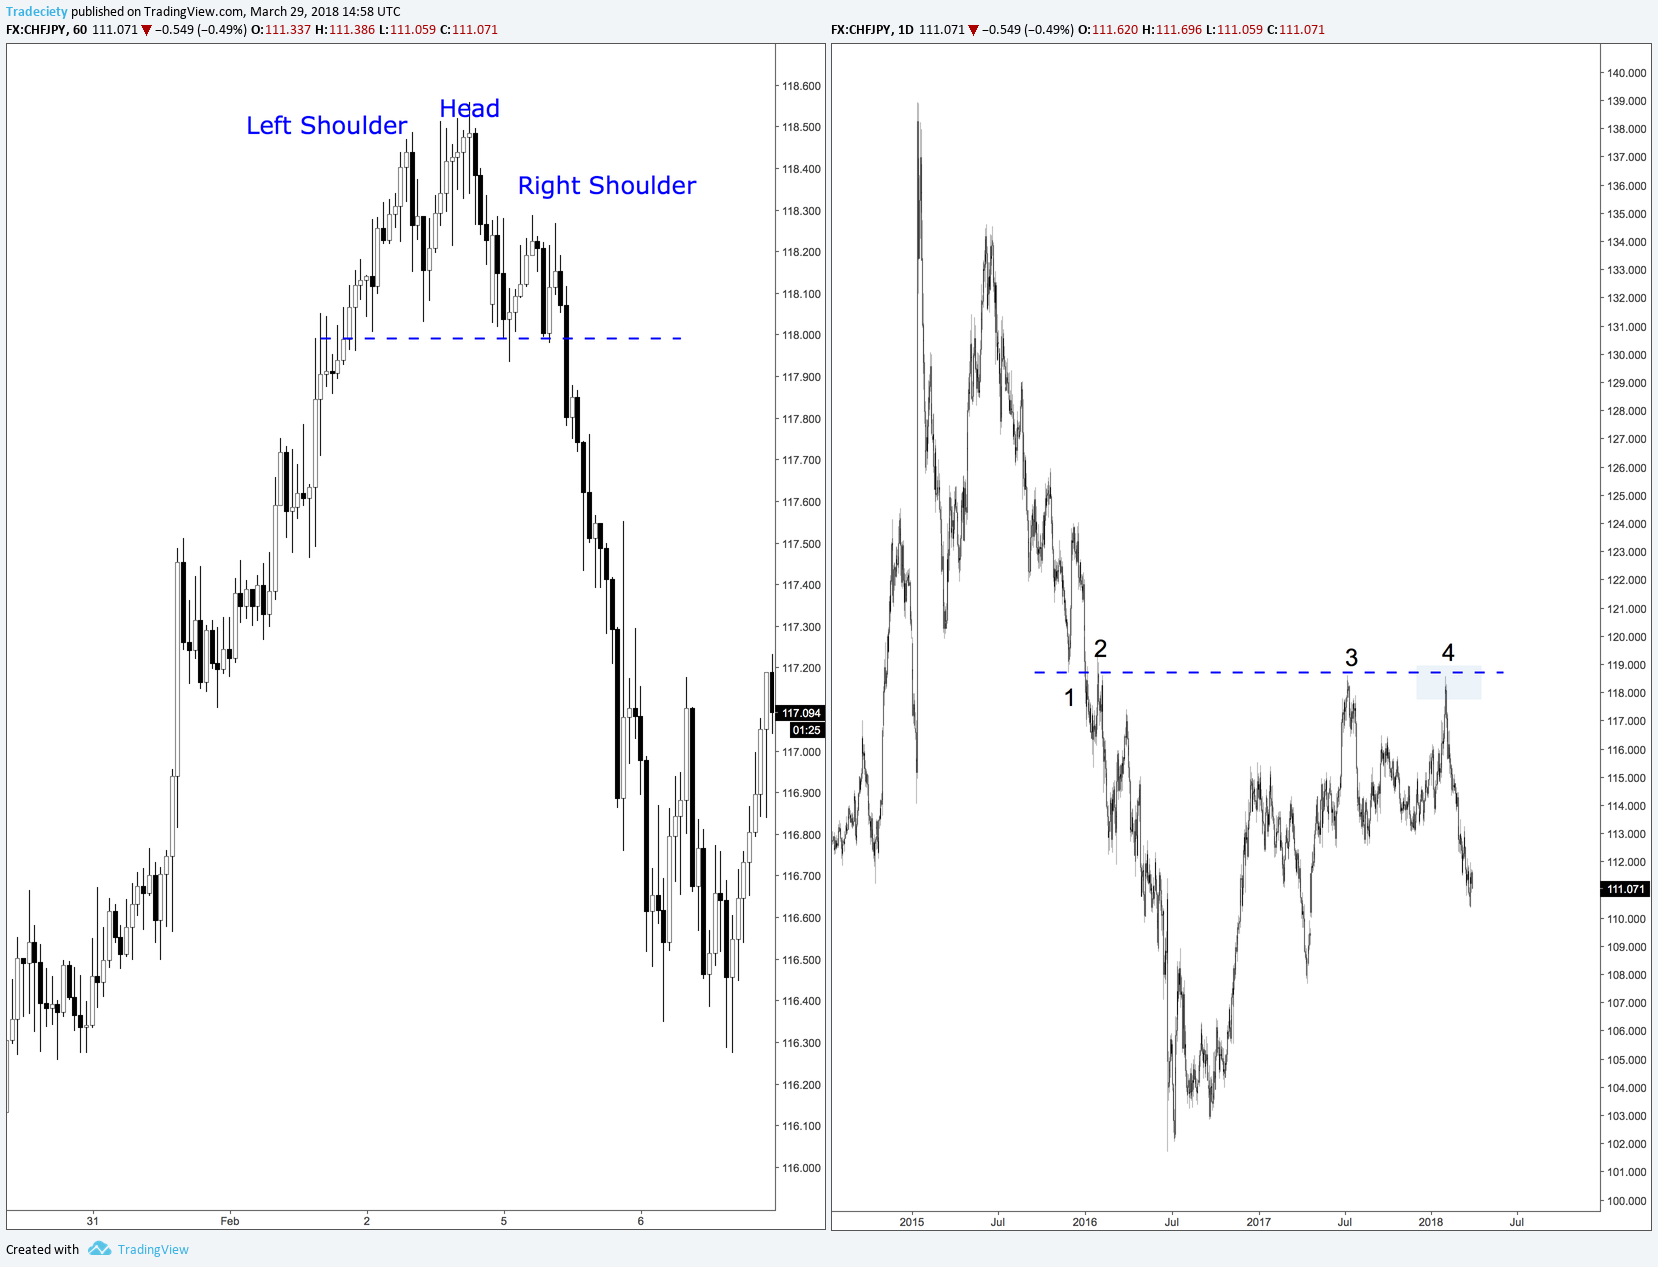
Especially important are strong rejection points and the stronger the price bounced off a level, the greater the supply and demand imbalance is. It’s very easy to get lost in drawing all the minor support and resistance levels at every possible turning point, but especially new traders would benefit from just focusing on the bigger picture. The chart below only has the biggest support and resistance levels marked.
Support and resistance levels are then used a “confluence” concepts and the best trading opportunities happen when a pattern or any other signal is given at a strong support or resistance area. The left Head and Shoulders was created at point #4 at the resistance area seen on the right chart scenario. The resistance level added a lot of context and confluence to the signal.
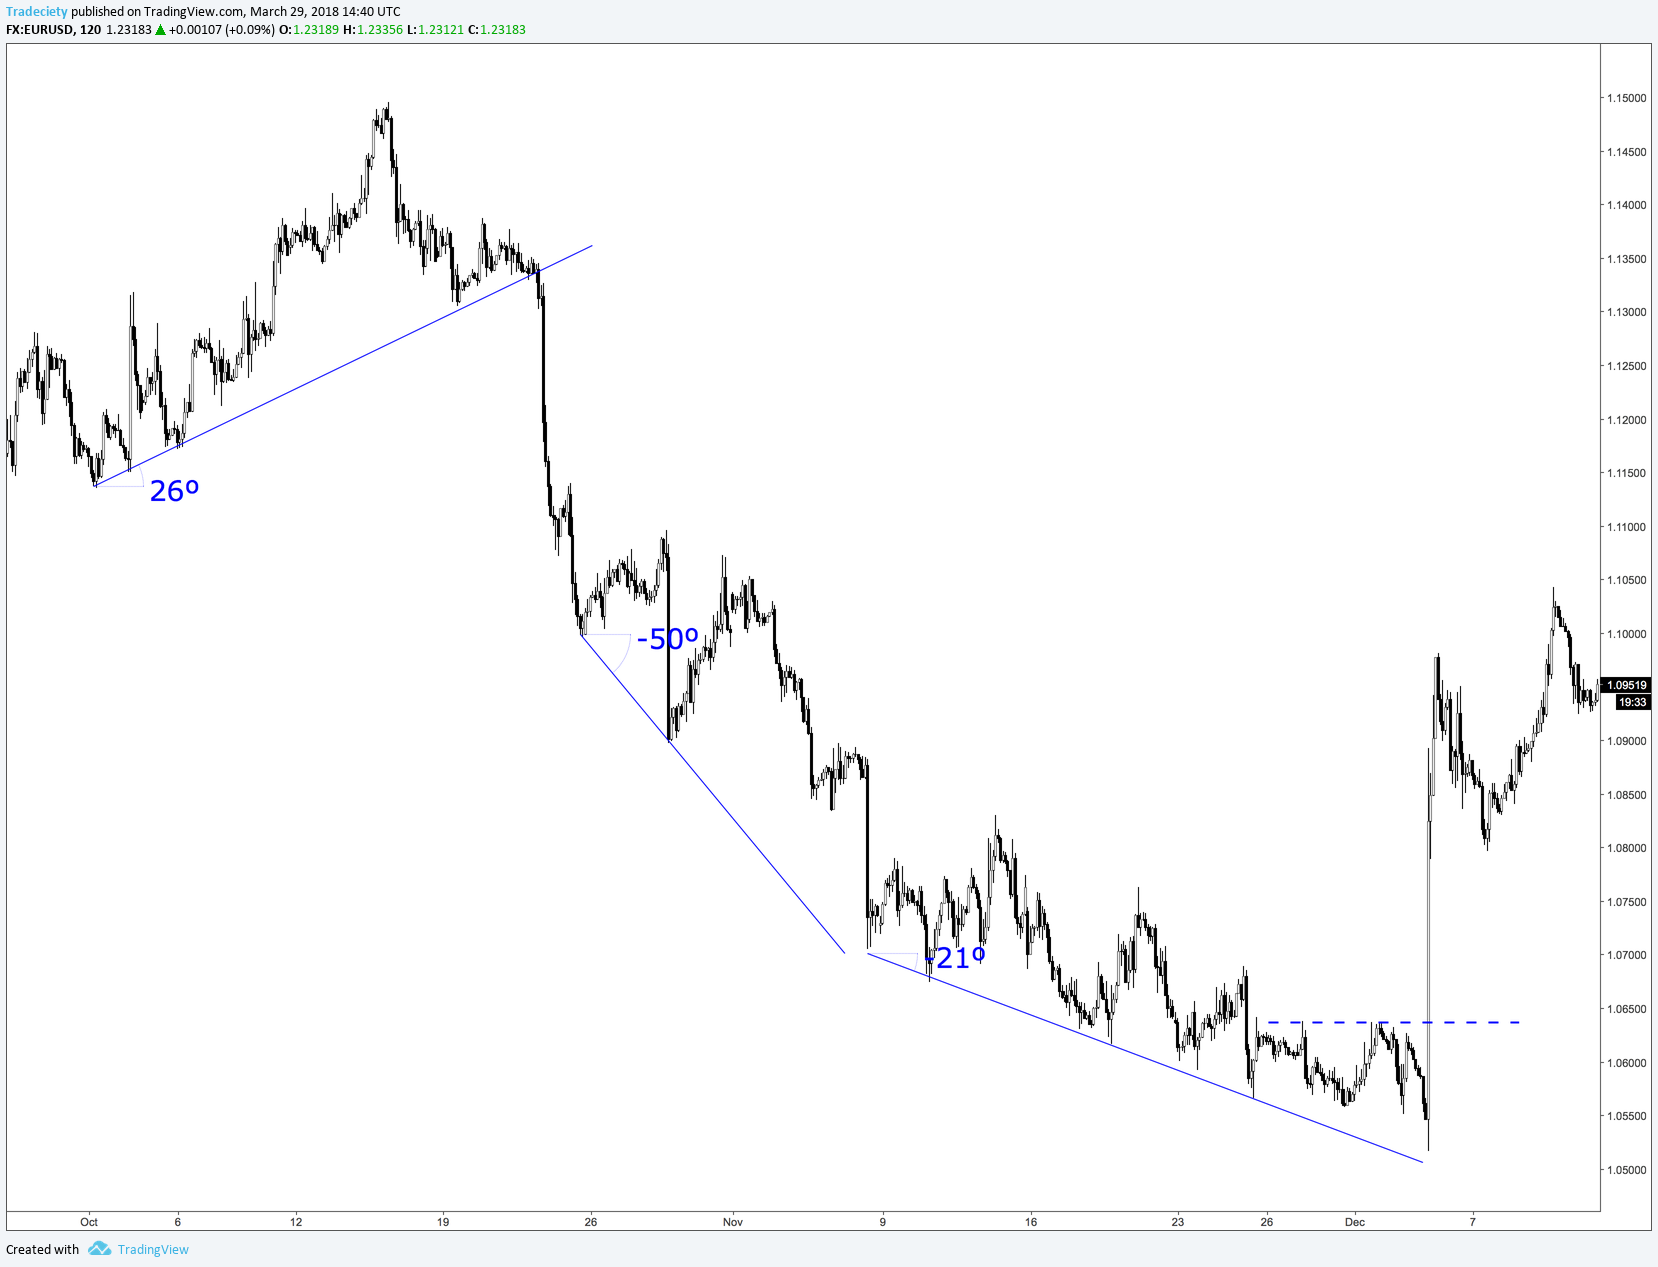
In contrast to support and resistance lines, trendlines are diagonal lines that also connect highs or lows, but slope upwards or downwards.
By connecting lows in an uptrend, a trader can draw a trendline that signals the direction of the trend. Furthermore, the angle of the trendline can provide information about the strength of the trend. In the chart below we can see that the downtrend is giving us two trendlines with a decreasing angle which means that the trend is losing strength.
We can already combine our knowledge of highs, lows and trendlines here to make effective chart analyses.
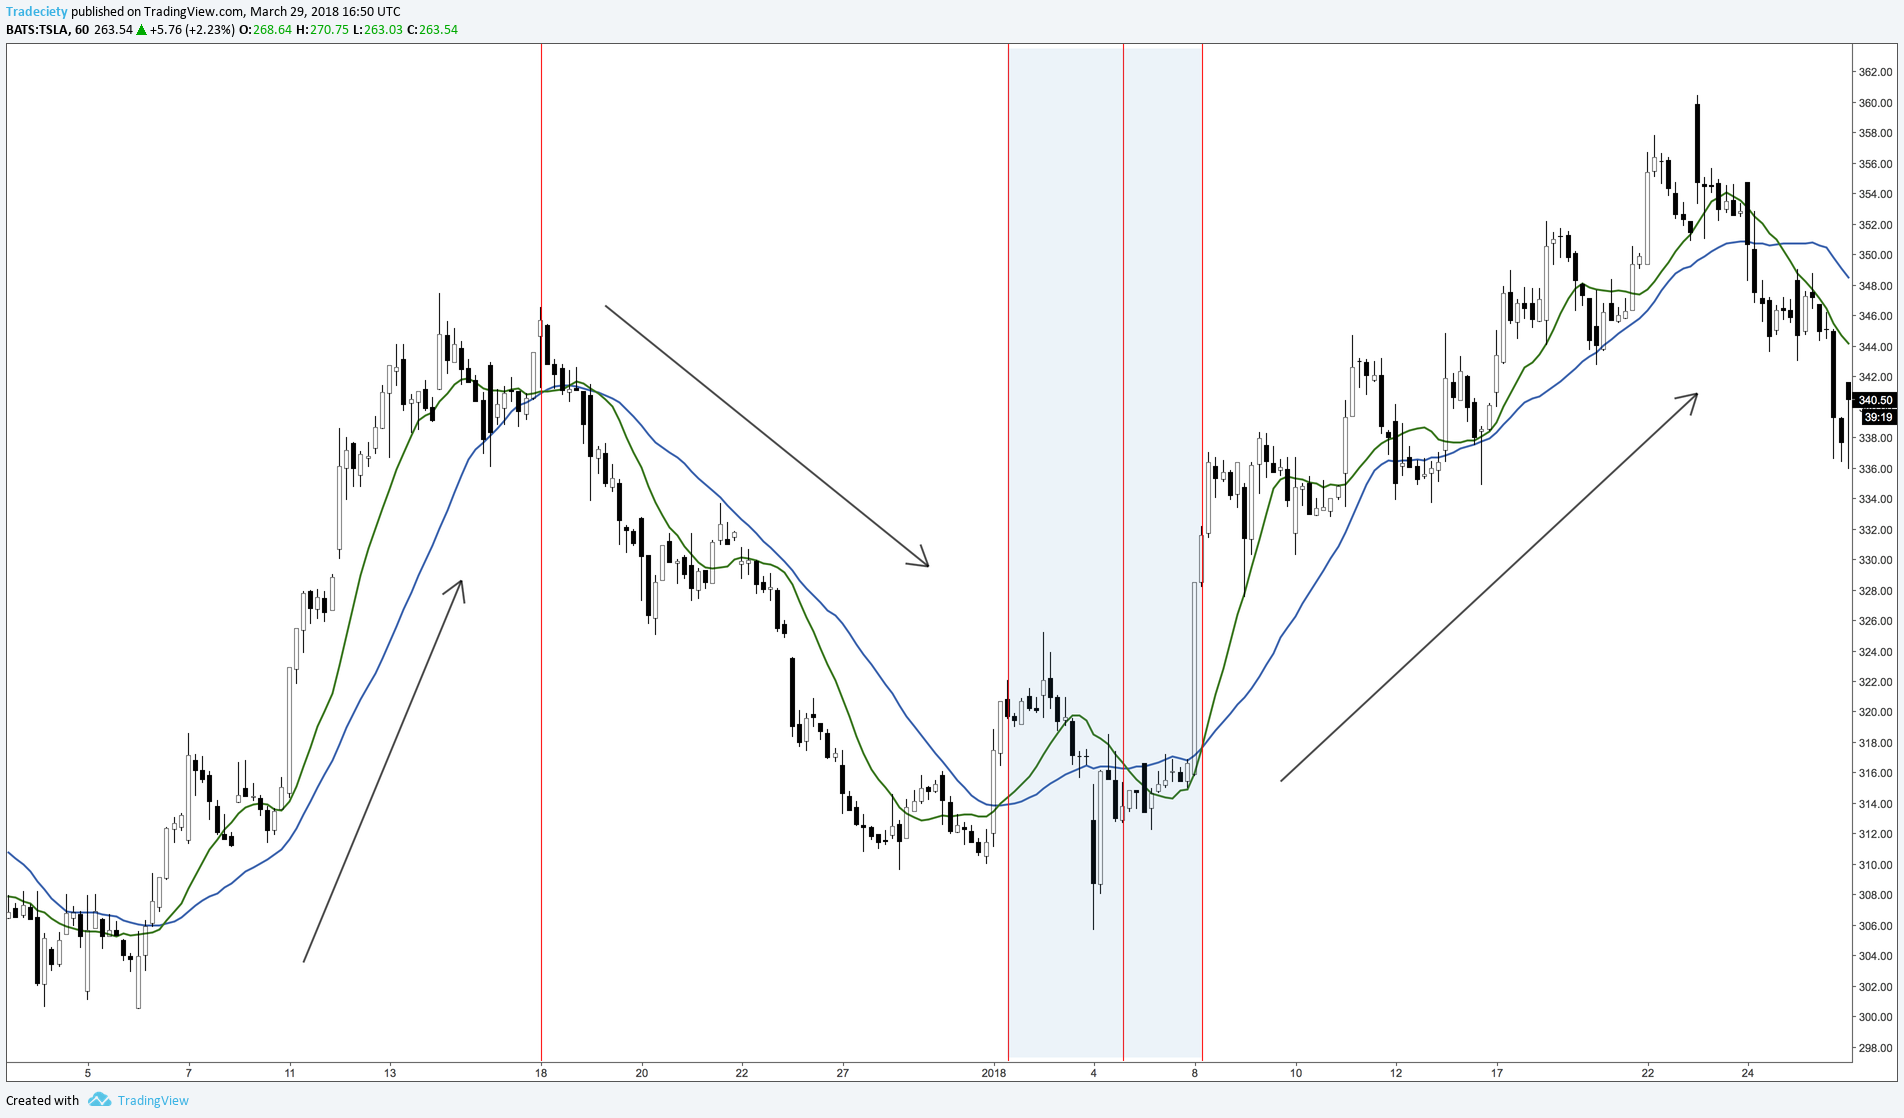
Moving averages are the most commonly used indicator and their main purpose are to analyze trend direction and changes in trend sentiment.
The chart below shows that when the price is below the moving average, we are in a downtrend and when the price breaks above the moving average, an uptrend starts. As Marty Schwartz, a successful trader who has been featured in the market wizards book series famously said:
“I call this ‘red light, green light’ because it is imperative in trading to remain on the correct side of a moving average to give yourself the best probability of success. When you are trading above the average, you have the green light, and you should be thinking buy. Conversely, trading below the average is a red light. The market is in a negative mode, and you should be thinking sell.”
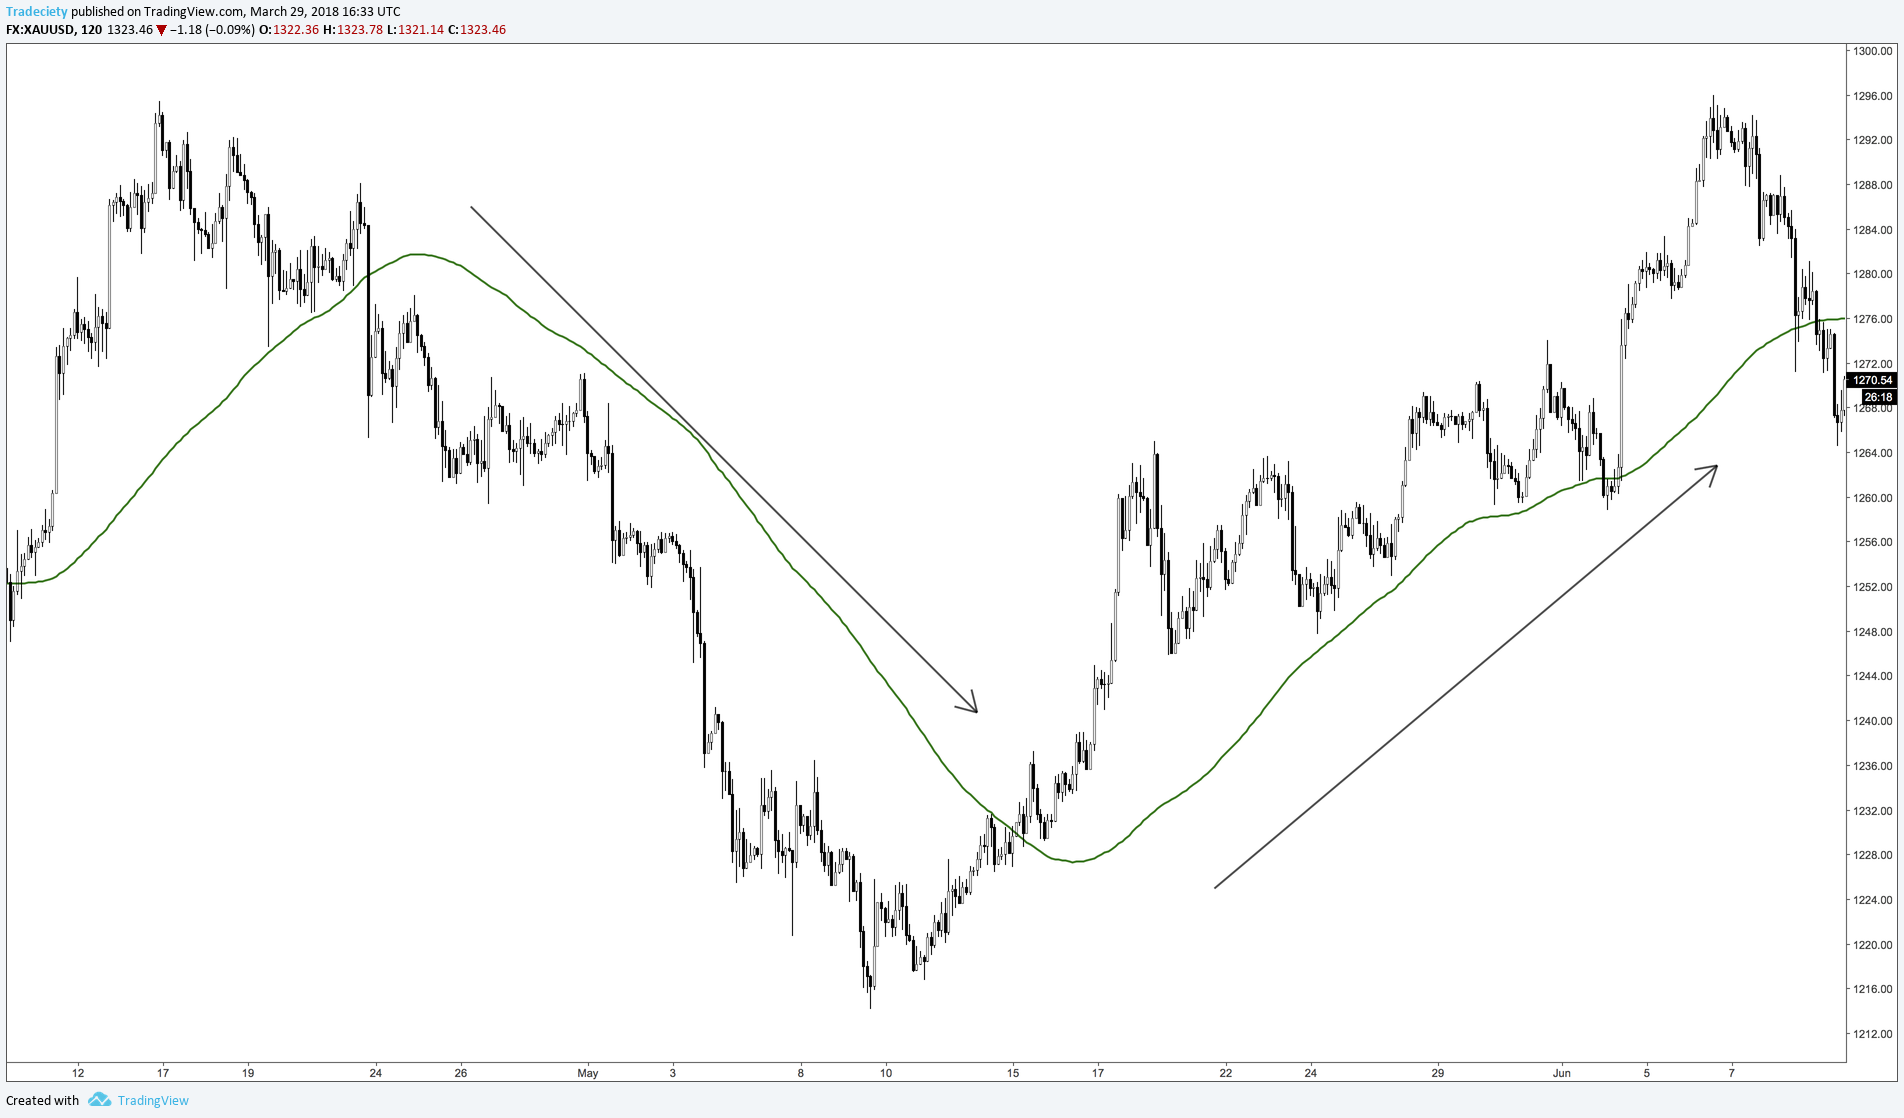
Another use case is when a trader uses two different moving averages together as a momentum tool.
When the two moving averages separate from each other, it means that the price is trending and that the trend strength is accelerating. The left scenario in the chart below shows that nicely.
When the price then cuts through the moving averages and the moving averages start separating to the downside, a new downtrend is created.
And when the moving averages are flat also close together, the price is in a sideways range.


external link:
external link:

3 min read
The following is a guest post from Michael Lamothe.
I'm Michael Lamothe, and today marks an extraordinary milestone: the first anniversary of "The...
3 min read
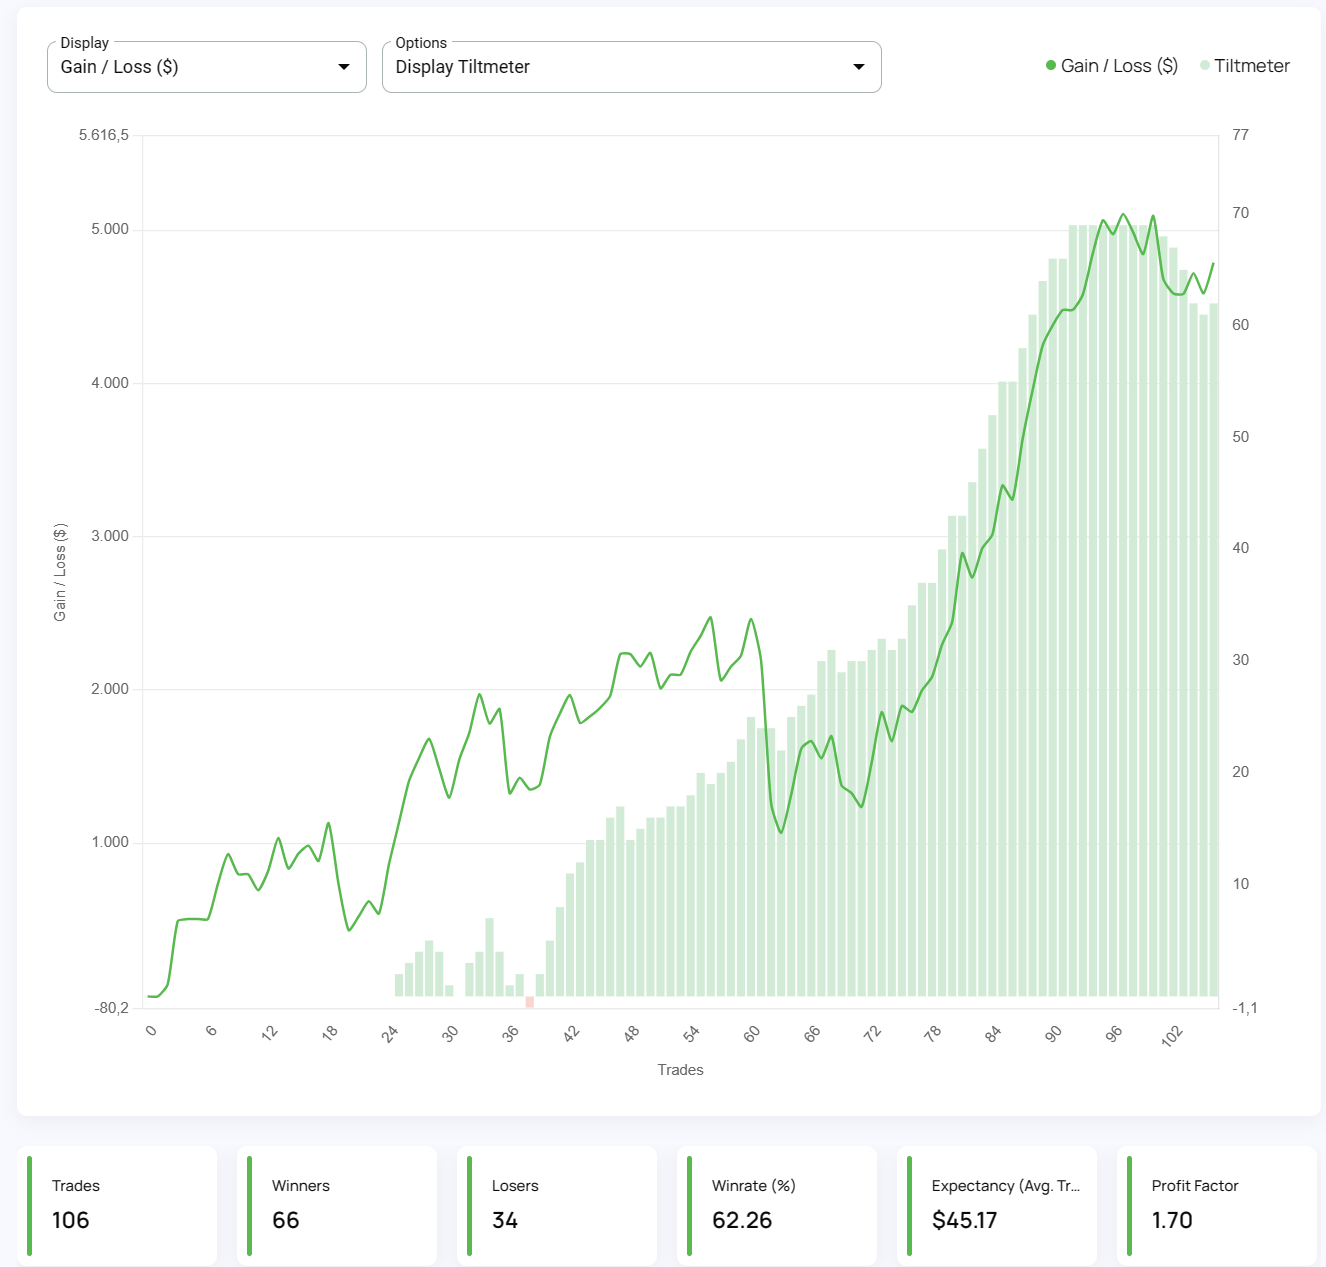
It's easy to get discouraged by losses and question your every move. But what if there was a way to track your progress, learn from mistakes, and...

8 min read
Dive deep into the world of finance and high-stakes trading with this selection of movies and documentaries! From the exhilarating thrill of...