4 min read
How to Review Your Trading Data - 6 Simple Steps
Have you ever reviewed your trading journal and felt lost? Many traders struggle to identify patterns and make sense of their performance. But what...

There is a point of no return when it comes to drawdown and it is closer than you might think. I often get this question, thus I am writing this article now so I can just send people here in the future.
My personal threshold is 15% drawdown from the high water mark. If I reach that level of drawdown, I reduce my risk drastically until I get back to a 10% drawdown from the peak. If I ever run into 20% drawdown from the high water mark, I stop trading completely and figure out what the hell is going on before putting on any more trades.
Luckily, I have never hit 20% drawdown (yet) due to managing my risk, using varying trade sizes on different setups and knowing my numbers, i.e. biggest historical losing streak and biggest mathematically possible losing streak in relation to winrate.
The reason why I chose 20% to be my line in the sand is obvious, take a look at this simple spreadsheet.
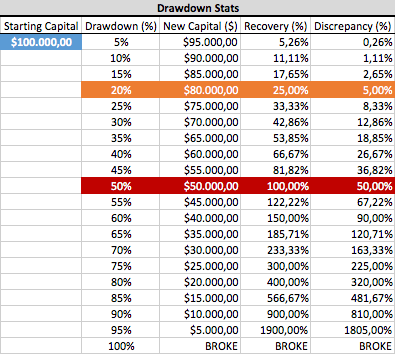
To make up for a 20% loss, we need to gain 25%. That is 5% more than we lost initially. To make up for a 50% loss, we need to gain back 100%. Anything beyond a 20% loss, the discrepancy we need to make up for becomes too much to bear. But here is the thing: if we use a %-based risk approach, the number of trades to lose 50% and to make 100% is the same.
Because we bet less and less as our bankroll shrinks and bet more and more as it grows, we need the same number of trades to lose 50% or to gain 100%, assuming we risk the same % on each trade. This is IMPORTANT to understand.
Of course, then you could ask me why are you such a little wimp about drawdowns? Well, firstly, there is the psychological factor. You could make 50% in year 1, and 50% in year 2, let’s say on a $100.000 account. That would leave you with an account of $225.000.
Now in the third year, you experience a 50% drawdown – and you are almost back to even ($112.500). That sucks. 3 years of work for nothing.
Besides, if you manage money, this is career suicide. And most importantly, the calculations above have not incorporated your expectancy, which is individual for each strategy. Assuming that you are a 2:1 trader with a 40% winrate and risk 1% per trade, you expect to make around 0.2% per trade. This is your expectancy.
Purely looking at the distribution of wins and losses which is – as we know – totally random, you could experience a losing streak of 10 trades, which would set you back around 10% on your account. With a 40% winrate, you will experience losing streaks like that and your biggest losing streak will be longer than your biggest winning streak.
To make up for those 10%, with an expectancy of 0.2% per trade, it would now suddenly take you 50 trades give or take – on average. A drawdown of 20% would take you roughly 100 trades. How many trades do you take per year? 100 trades could be a long time. And that is “only” to make up for a drawdown of 20%.
Additionally, losing so many trades in a row will mess with your mind and probably decrease your winrate, making your situation even worse.
Thirdly, commissions and fees – yes, a “small” factor, but still a factor. Especially with the size of retail traders’ accounts.
So, I don’t really care what your strategy, what your key performance indicators are, and so on, the universal truth is you NEVER want to go beyond a 20% drawdown, for a ton of reasons. And once you hit what I like to call the “death zone” between 10% and 20% drawdown, reduce your risk and keep it that way until things go your way again.
Once we have established the 20% drawdown as the line in the sand, the next question comes up: how much % should we risk per trade then? For this, we have to look at our biggest historical losing streaks IN CONJUNCTION with our average loss (%), or we could extrapolate our numbers (winrate, average risk:reward, risk%) into the future, for example with Edgewonk.
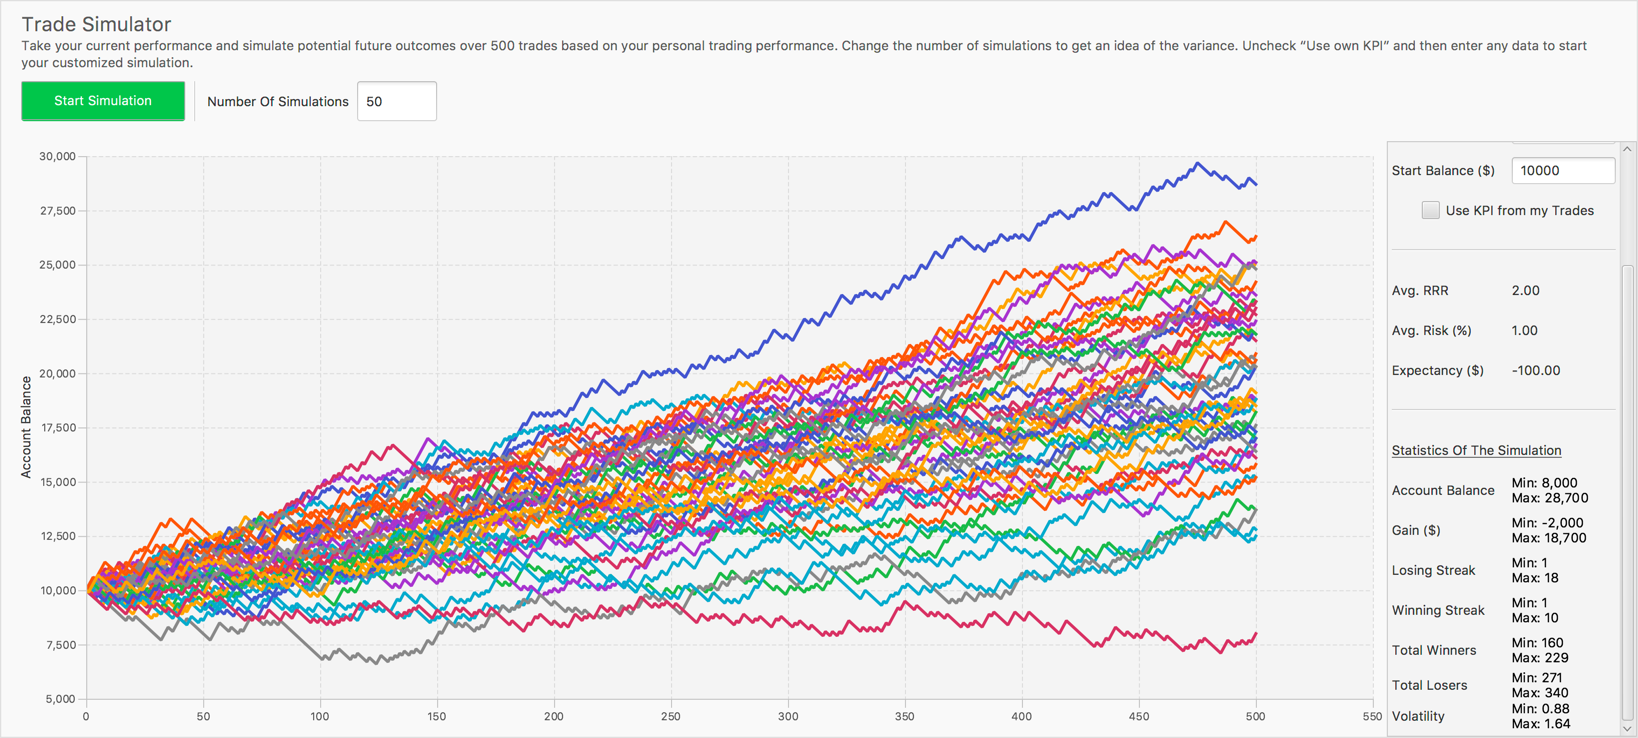
With the numbers we assumed above (2:1 RRR, 40% winrate), this is how it could look after 500 trades. One outlier lost money, one outlier made a lot of money, the rest is hovering between a 25% and a 250% gain.
Looking to the right, the maximum losing streak is 18, the maximum winning streak just 10. So, 18 losing trades in a row with a winrate of 40% is possible. That means then, that a losing streak of 10 trades is absolutely nothing out of the ordinary with a 40% winrate.
Assuming we risk 2% per trade, that could hurt us badly – we would crash right into that 20% line in the sand or end up somewhere in the death zone. Risking 2% per trade is way too much for this strategy, even with a positive expectancy. I would go for 1% with numbers like these, maximum 1.25%.
So, after we established a 20% drawdown as the line in the sand and a 10%-15% drawdown as our risk-reduction-threshold, these are the things we must do in order to assess our ideal risk per trade.
Knowing these numbers, you can then assess a risk per trade size somewhere between 0.5% and 2.5% in relation to the 20% rule that minimizes the chances of you ever crossing the line in the sand while maximizing your profits instead of simply going with a general rule.
Also, note that cutting losers and letting winners run doesn’t affect your winrate or biggest losing or winning streaks but it definitely affects your average winners and losers ($/%), which ultimately then find their expression in the expectancy and your average RRR, so to know these numbers is incredibly important.
As a general rule of thumb, I would choose my risk per trade such that I never cross the 15%-line, so you still have a buffer to the trading stop. Any questions, as always, in the comments below.

external link:
external link:

4 min read
Have you ever reviewed your trading journal and felt lost? Many traders struggle to identify patterns and make sense of their performance. But what...
3 min read
The following is a guest post from Michael Lamothe.
I'm Michael Lamothe, and today marks an extraordinary milestone: the first anniversary of "The...
3 min read
It's easy to get discouraged by losses and question your every move. But what if there was a way to track your progress, learn from mistakes, and...