5 min read
The 10 Biggest Stock Market Crashes of the Last 100 Years
The past century has been a wild ride for investors. This article explores ten of the most dramatic plunges the stock market has witnessed, from the...
You could make a living trading only this pattern. In fact, I know a guy that trades only this pattern on the GBPJPY 5-minute charts and is doing well. It grants nice RRR, good hit rates, easy trade management, clear targets and clear stop losses. The thing I am talking about is the Ascending Triangle Continuation Pattern (ATCP) in an uptrend and the Descending Triangle Continuation Pattern (DTCP) in a downtrend.
It is easy to identify, the logic behind it is impeccable, we have a clearly defined breakout-border and we are going with the trend. The advantages are numerous, there are no disadvantages to this pattern, to be honest. Here are examples of the Stocks, Futures and Forex markets.

GBPJPY, 5-minute scale.
4 hits on the upper boundary, 5 hits on the lower boundary
with a premature breakout that would not have triggered an entry, though.
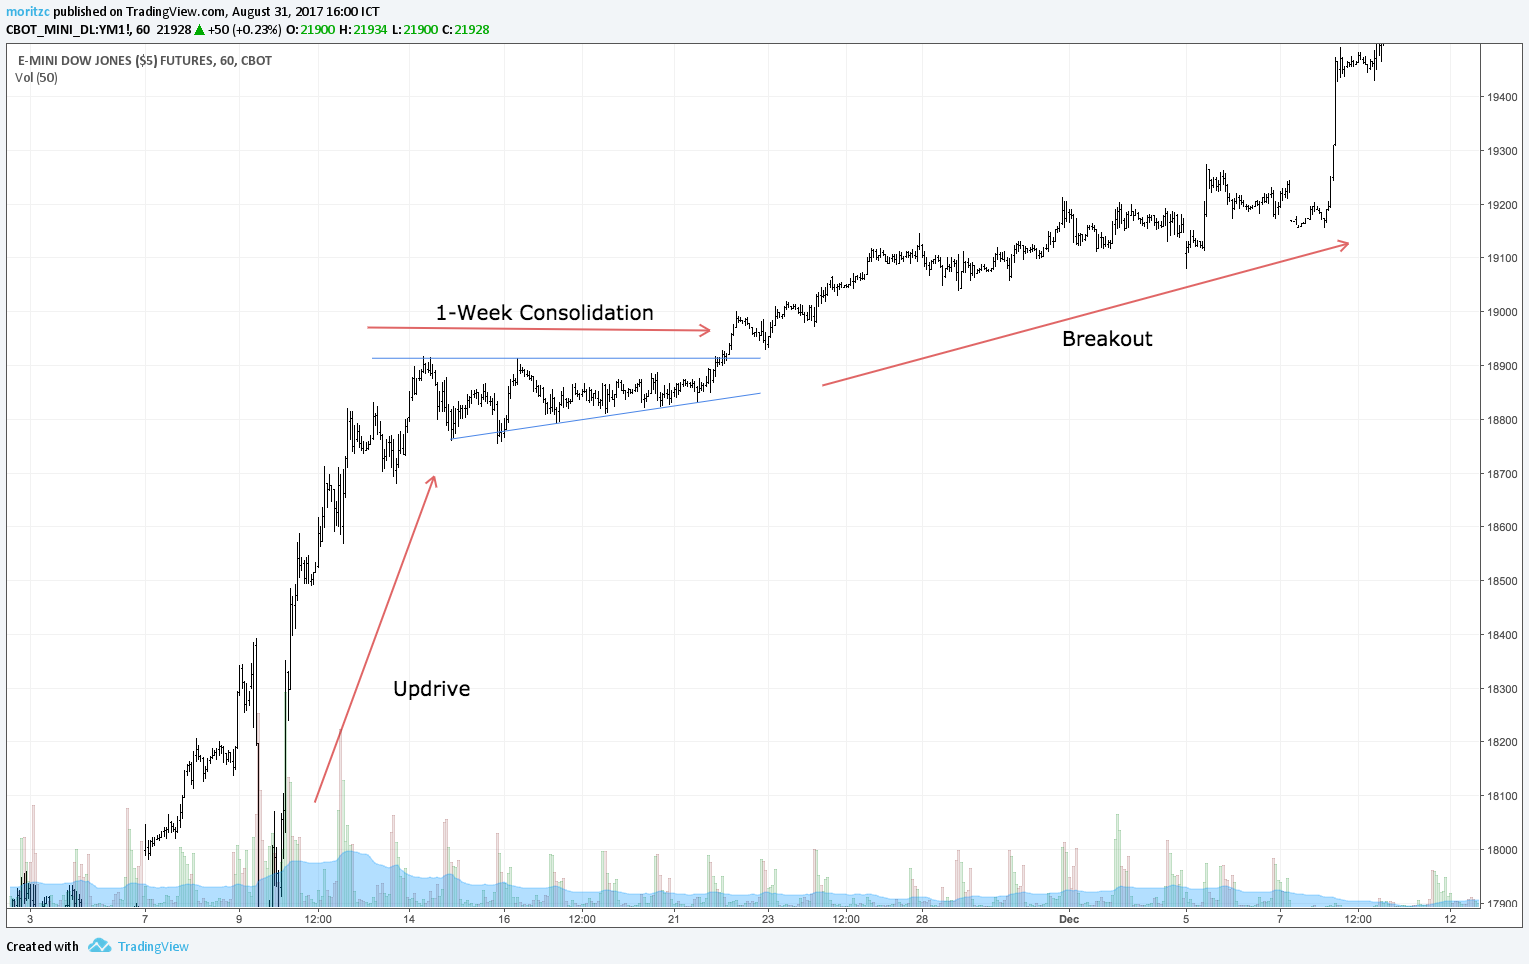
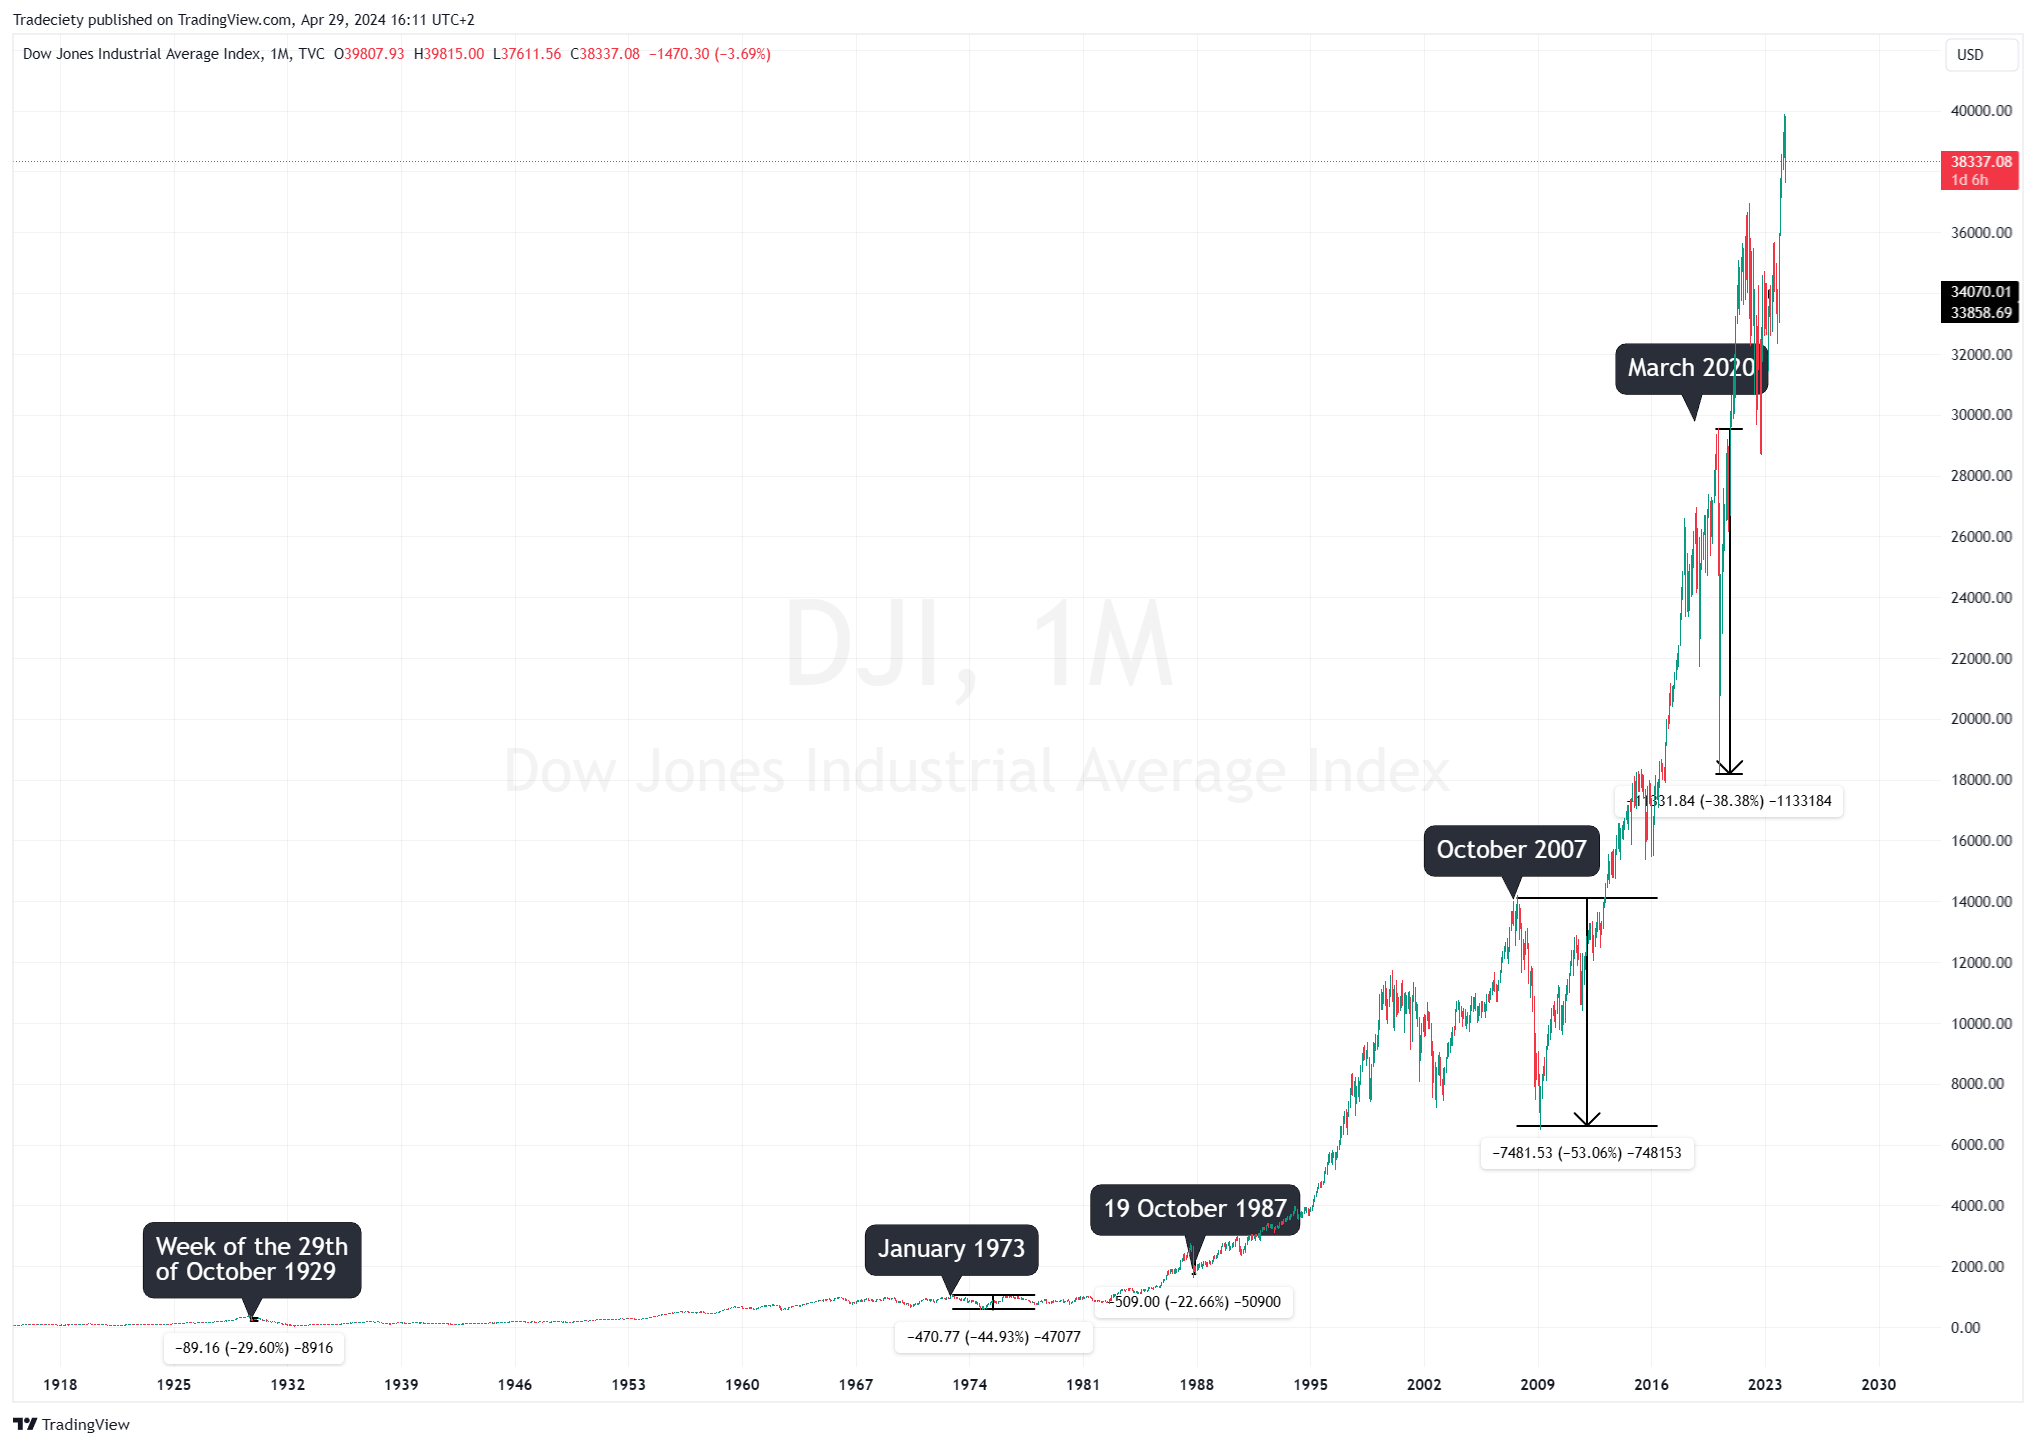
eMini Dow Jones, hourly scale.
7 hits on the lower boundary, 2 hits on the upper boundary.
Notice how the lower trendline cuts through one of
the lows – we always want to find the one with the most confluence (hits).
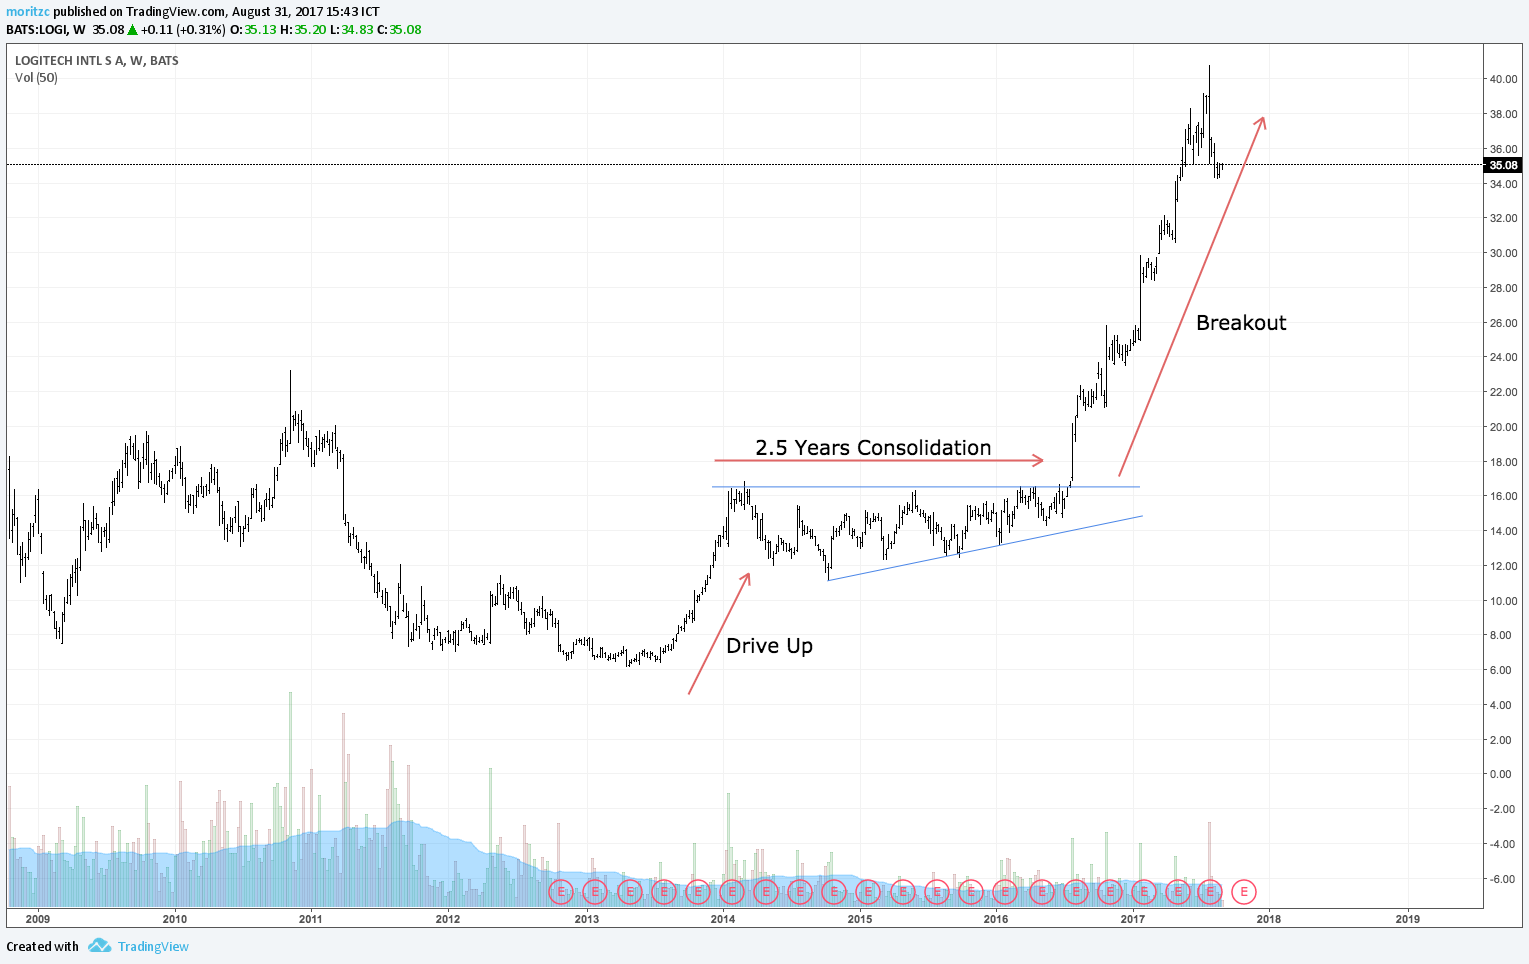
Logitech individual stock (NASDAQ), weekly scale.
4 hits on the upper boundary, 4 hits on the lower boundary. Violent breakout.
Ok, easy enough, isn’t it? Now, how do we enter, how do we exit, where do we put our stops? Let’s look at the Logitech example on the Daily chart to clarify this – it is advisable to always go 1-2 time frames lower after you spotted one of these consolidations in order to time your entry, especially in markets that like to gap and/or offer you Level2-information so you can see in greater detail how traders behave when price is approaching the consolidation boundary.
So, entry. Classic charting gurus Edwards/Magee state that a close beyond a 3% margin of the breakout level will confirm the breakout and help protect us from fakeouts. If you are daytrading, test whether this rule works for you or not. On the daily charts, it has worked very nicely for me. Below is the example on the daily chart of the Logitech breakout.
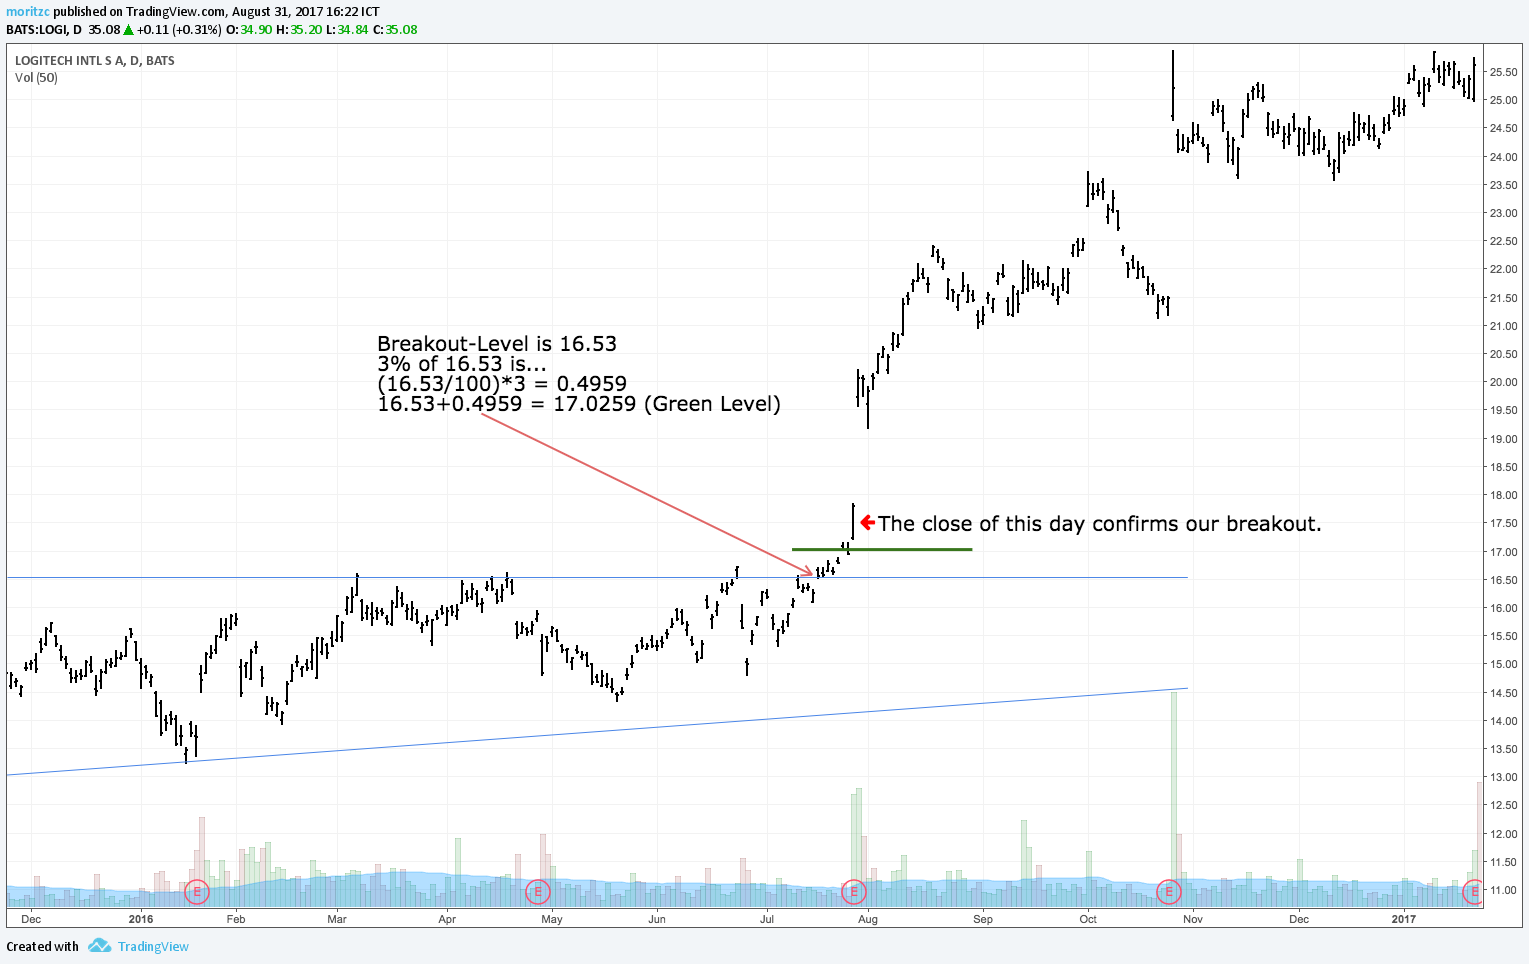
Now there are other factors to consider, of course – the strength of the bar that confirmed the breakout, the strength of the breakout volume (very strong in this example, 5 times the 50-day moving average). Fundamental factors? Here we had strong earnings, for example. And so on, you can create your own rules or simply stick to the 3% margin, just test it, test it, test it.
Then the stop loss – we could, for example, go with Peter Brandt’s Last Day Rule here (the low/high of the last bar that opened inside the pattern), or put it behind the bar that confirmed our breakout, or put it behind S/R – again, test. If I get huge breakout volume on a clearly defined pattern and maybe a fundamental catalyst, I usually put my stop right behind the bar that confirmed the breakout via the 3% margin because these trades tend to just explode and I would rather want to increase my RRR instead of having a useless stop somewhere inside the pattern that will never get contested in any way. See picture below.
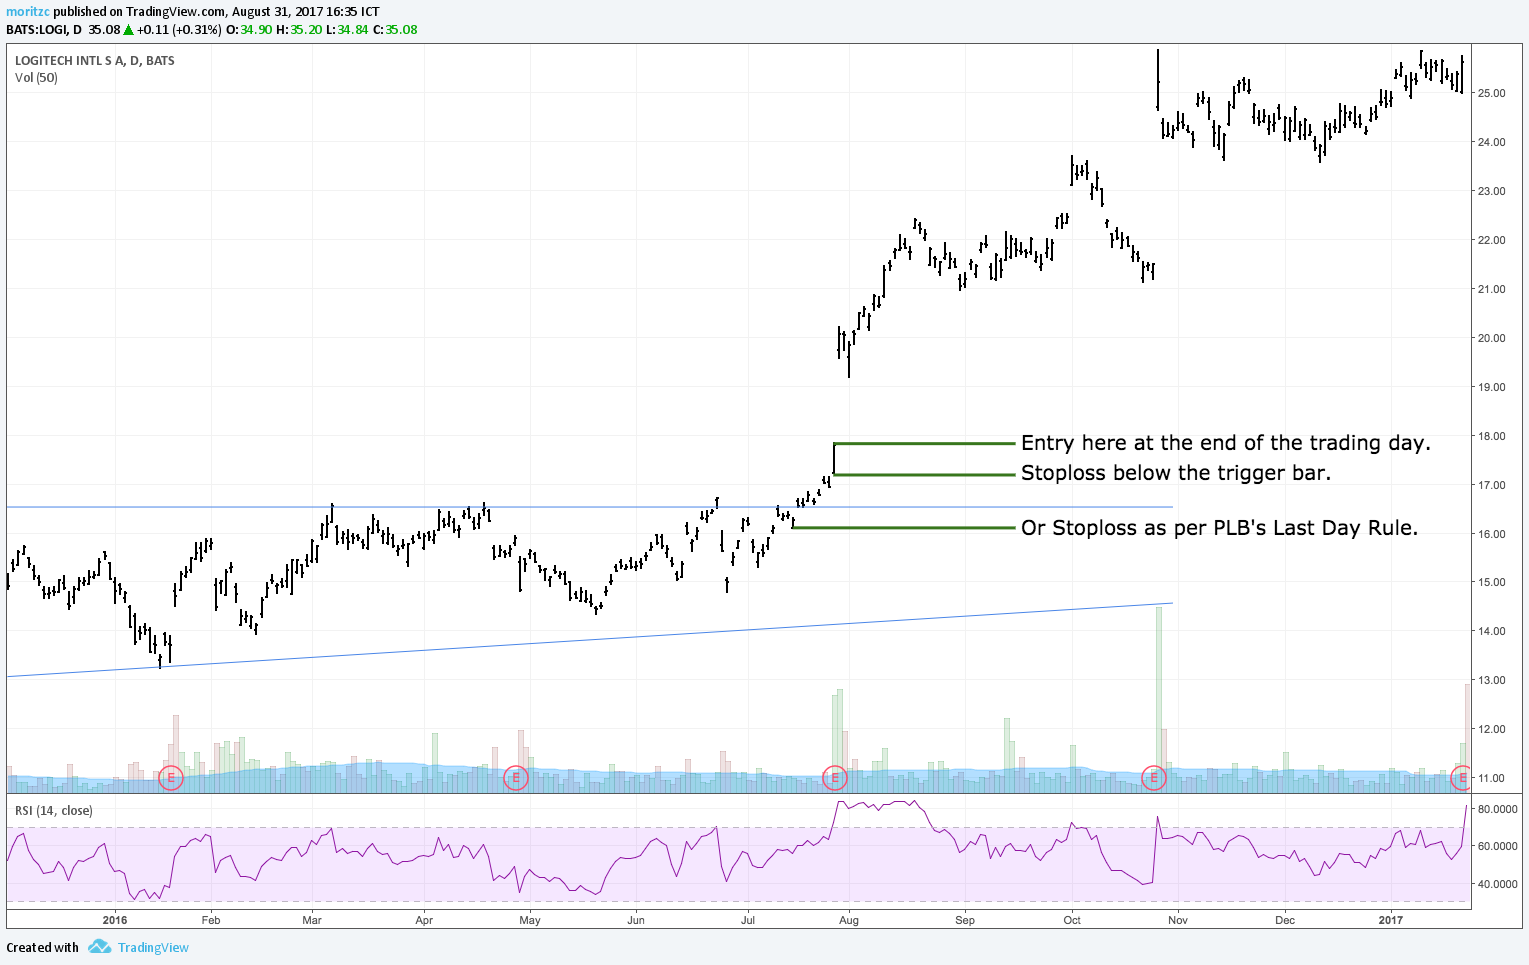
Also notice the RSI I put on – the breakout was confirmed by the close of the RSI above the 70 level, as well. As I said, you can add your own criteria to rate the quality of these breakouts and see, what works for you.
Now, targets – classic charting principles state that we should aim at the highest distance inside the pattern added to the breakout level. See picture below.
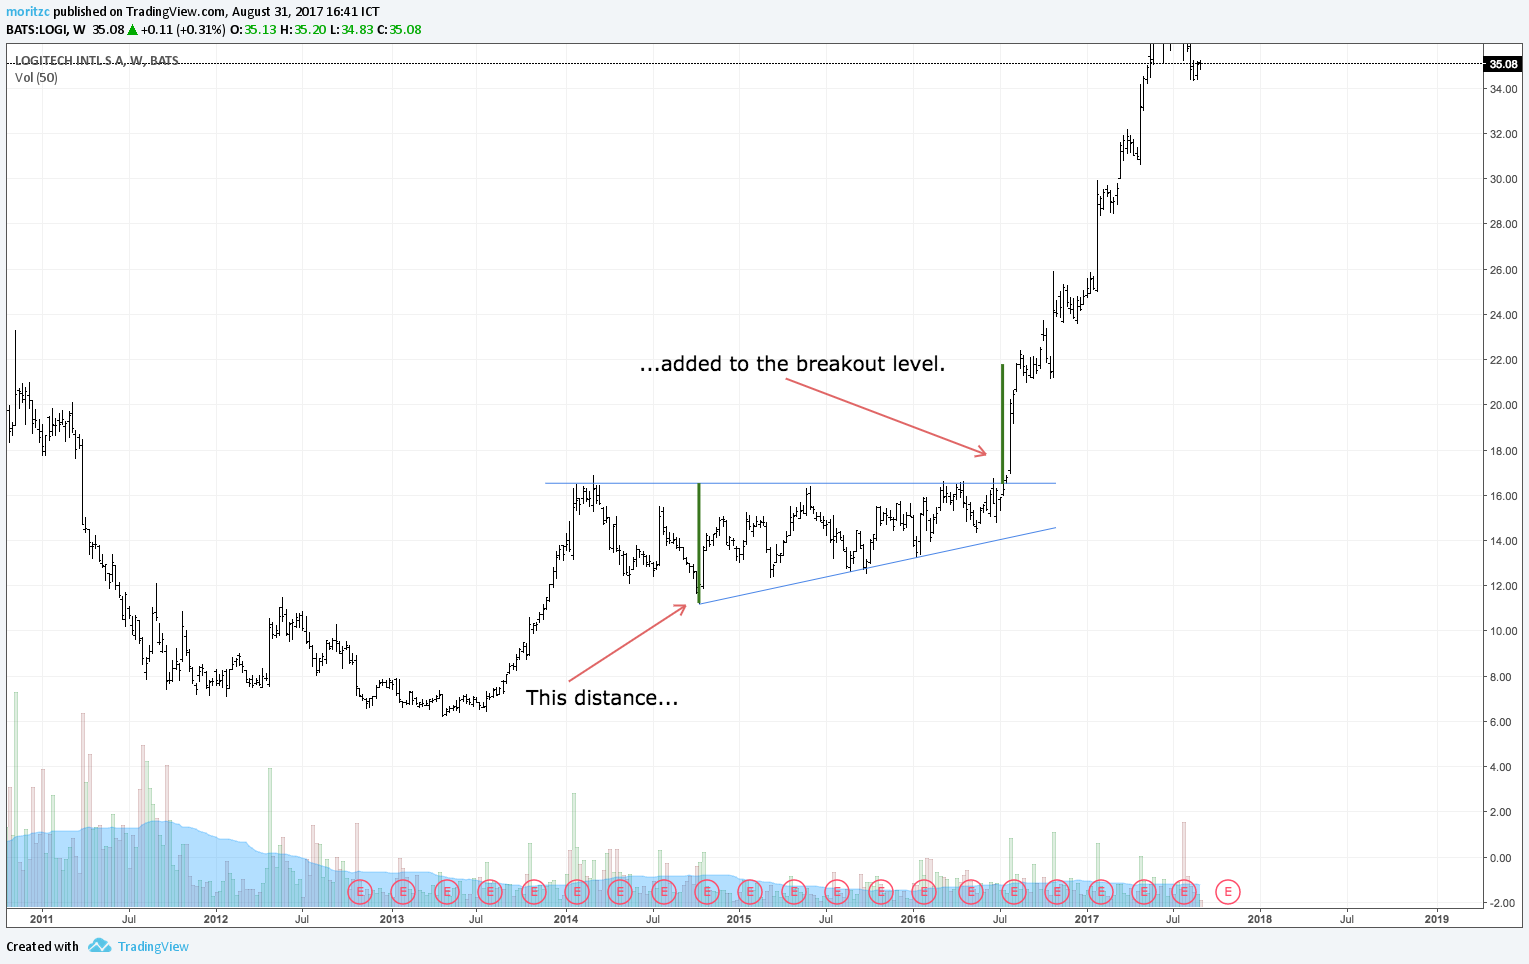
As we are trading with the trend, often this target will easily be overshot so it simply is a general rule of thumb. Take 1/3 of your position off and trail the rest, for example. Again, due diligence is your responsibility, test what works for you.
I don’t enter these patterns unless I get a 3:1 RRR or better which helps keep me out of a lot of bad trades, as well. And that’s basically it. Note that each of the boundaries must have at least 2 hits, and the more the better, of course. Also, declining volume (=declining trading activity) during the creation of the consolidation is a huge bonus.
You have to find a way for yourself to grade a) the quality of the consolidation (length, boundary-cleanliness, volume, economical patterns…) and b) the quality of the breakout (volume, bar strength, decisiveness), and then you can for example establish a scoring system and see how well your trades do with scores from 1-10, then bet more on the trades with a higher score, etc.
You can get really creative and go in-depth with your analysis while still keeping it simple with just one pattern to master, which is usually the secret of any working trading strategy. Important is, we need to be in an uptrend and/or downtrend and then have a horizontal boundary in the direction of the trend, and price is crashing against it like waves against a rock, but each time it crashes against the rock, the retracement becomes smaller and smaller (as can be visually seen by drawing our other boundary, the trendline). This means that the interest to trade into the other direction is dying off and pressure to break out into the direction of the prevailing trend is increasing…and increasing…and increasing until everything goes BOOM. Enjoy.

external link:
external link:

5 min read
The past century has been a wild ride for investors. This article explores ten of the most dramatic plunges the stock market has witnessed, from the...

4 min read
Have you ever reviewed your trading journal and felt lost? Many traders struggle to identify patterns and make sense of their performance. But what...
3 min read
The following is a guest post from Michael Lamothe.
I'm Michael Lamothe, and today marks an extraordinary milestone: the first anniversary of "The...