Supply and Demand Trading in 2026
We have been trading supply and demand strategies for over ten years, and they have stood the test of time remarkably well. Supply and demand is...
Money Flow Index (MFI) is basically a momentum indicator that oscillates between a reading of zero to a hundred. However, there is a major difference between the Money Flow Index and some of the other popular oscillators. Unlike the Average Directional Movement (ADX) or Relative Strength Index(RSI), the Money Flow Index’s mathematical model takes volume data into consideration. Hence, traders often call this indicator the volume-weighted Relative Strength Index.
In order to integrate any technical indicator into a trading system, it is important to become familiar with what the indicator values represent. To understand what the Money Flow Index indicator reading represents, first, we need to understand how the indicator value is calculated.
The creators of the indicator, Gene Quong, and Avrum Soudack, came up with an ingenious solution to incorporate volume data into the indicator in a few simple steps.
The Money Flow Index is primarily a visual representation of the so-called “money ratio.” However, to get the “money ratio,” we need to calculate a few other things first. Namely, the typical price and the money flow.
Like the Relative Strength Index, the Money Flow Index is also based on the concept of “Typical Price,” which is the average of a time period’s High, low, and Closing price. For example, if the EURUSD daily time frame’s High was 111.50, Low was 110.00 and Closing price was 110.15, then the typical price of the day would be (111.50+110.0+110.15) / 3 = 110.55.
Next, we need to calculate the money flow itself, which is simply a multiplication of the typical price and the volume of the day. Once we have the money flow, we can compare it to the previous day’s money flow to know if it is a positive money flow or a negative one.
It is very simple, really. If today’s money flow is higher, it is a positive one, if not, then it is a negative one. If it’s equal, just discard the day’s data!
Once you have your positive and negative money flows, then you need to divide the positive money flow by the negative money flow to calculate the money ratio. Now, in the final step, you can simply use the following formula to calculate the Money Flow Index:
MFI = 100 – (100 / 1 + Money Ratio)
While the Relative Strength Index (RSI) or other oscillator type technical indicators can also identify overbought and oversold market conditions, the Money Flow Index is particularly good at this job. The additional volume information helps the Money Flow Index weed out false overbought and oversold signals, making it rather reliable if you want to trade against the prevailing trend.
Like most momentum indicators, the Money Flow Index value also oscillates between a reading of 0 and 100. As you can probably guess it by now, when the Money Flow Index value drops below 20, it generates an Oversold signal. On the other hand, if you see the Money Flow Index value going above 80, you can take that situation as an Overbought market condition.
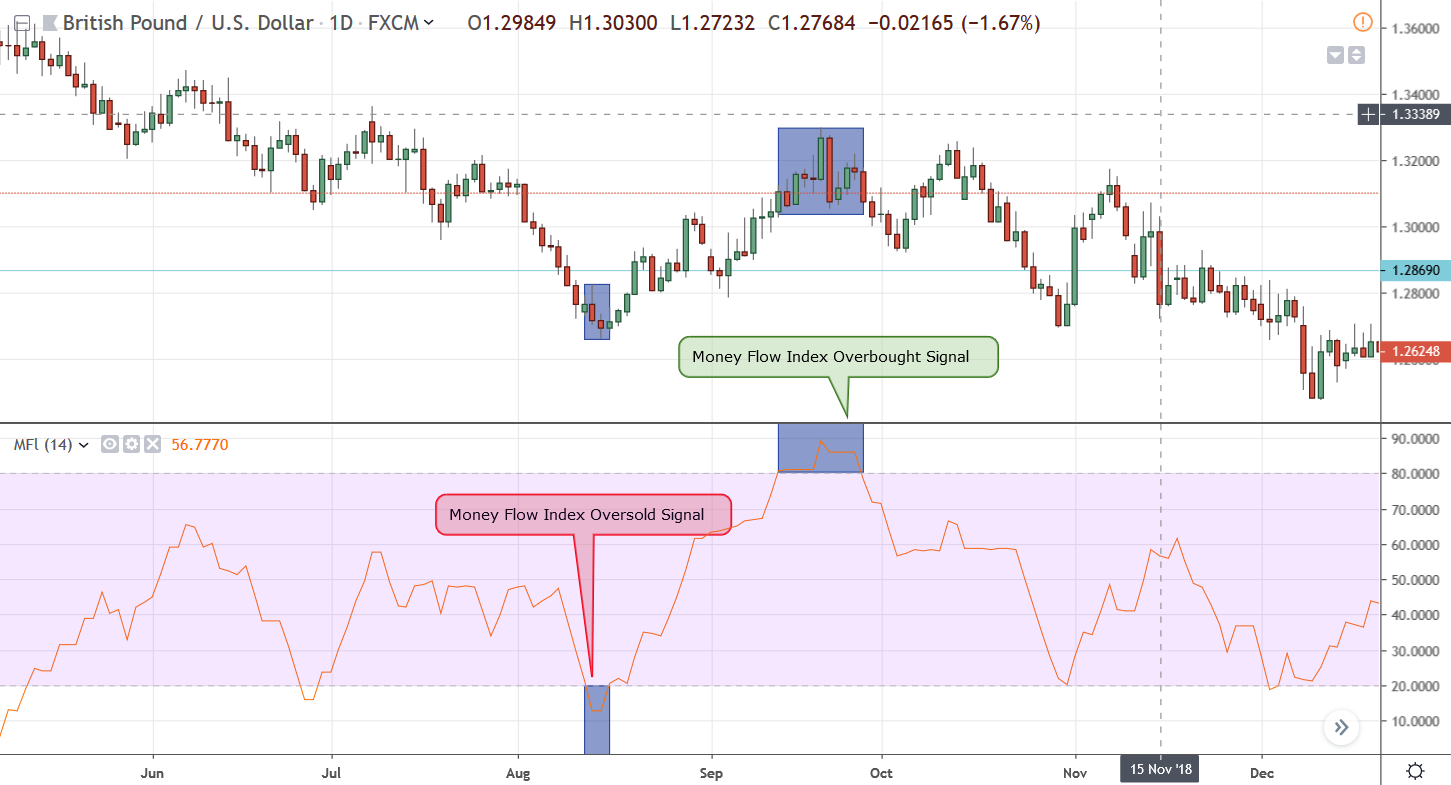
 Figure 1: Overbought and Oversold Signal Generated by the Money Flow Index Indicator
In figure 1, we have highlighted that the Money Flow Index of GBPUSD went below the 20 level on August 13, 2018, on the Daily time frame. It signaled that the market is probably oversold. Within a few days, on August 16, 2018, the GBPUSD crossed above the 20 level once again, and a fresh bullish trend followed.
Similarly, when the Money Flow Index went above the threshold of 80 on September 13, 2018, it generated an Overbought signal. On September 27, 2018, the indicator reading finally came below the 80 level, and we saw the start of a new bearish trend.
The problem with trading most overbought and oversold signals is that you cannot simply take a position against the trend simply because the Money Flow Index generated a signal in either direction. The best way to trade it would be waiting for a confluence in terms of price action patterns to confirm the change in the prevailing trend.
Besides accurately signaling Overbought and Oversold market conditions, the Money Flow Index indicator can also help traders identify divergence in the market. Bluntly, divergence happens when the price action of an asset goes one way, but the indicator reading continues to go in the opposite direction. When such market condition exists, traders can interpret it as a sign that the directional movement of the price action will soon reverse in the direction of the underlying technical indicator.
With the Money Flow Index, we can easily identify such divergence signals be it a bullish divergence or a bearish divergence.
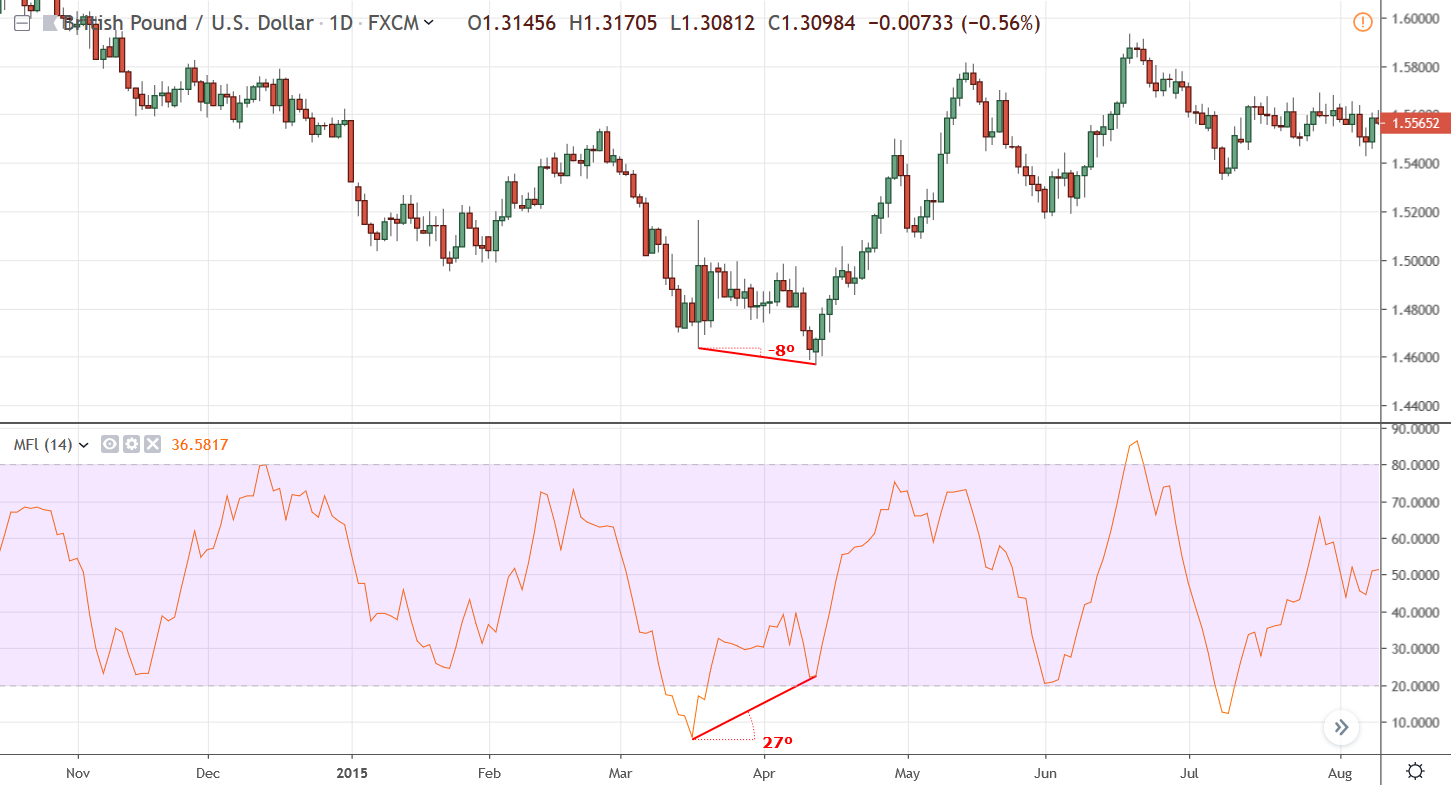
Figure 2: Identifying Bullish Divergence with Money Flow Index
In figure 2, starting from March 17, 2015, the Money Flow Index reading started to go up and formed a 27-degree uptrend line by the end of April 13, 2015, on the daily timeframe. However, at the same time period, the GBPUSD price action continued to go down with a negative 8-degree angle. Hence, it constituted a bullish divergence.
As we can see, starting from April 14, 2015, the GBPUSD price action replicated the direction of Money Flow Index reading and the pair went on have a sharp reversal of the bearish trend, ending up forming a new bullish trend on the daily timeframe.
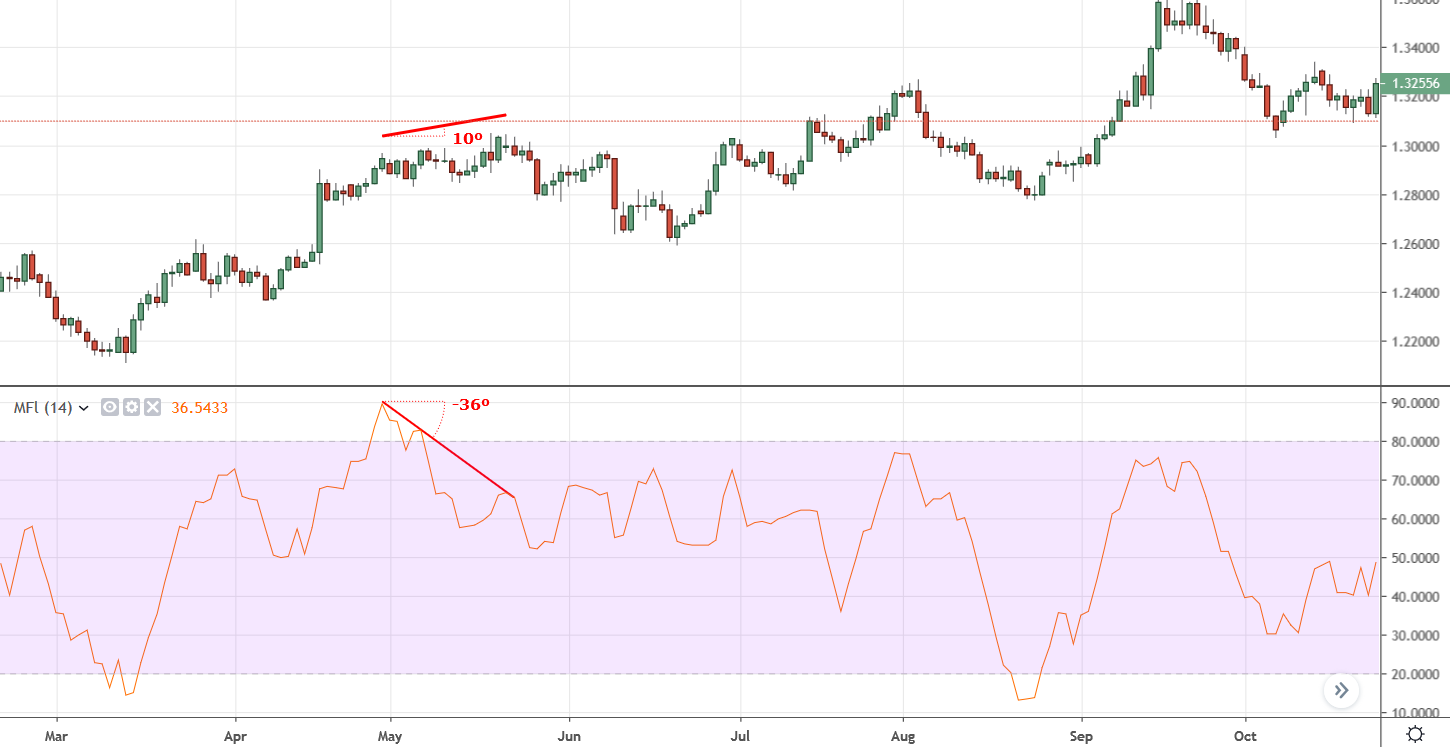 Figure 3: Identifying Bearish Divergence with Money Flow Index
In figure 3, we can see that the GBPUSD price kept going up with a 10-degree angle starting from April 28 to May 18, 2017, on the daily time frame. However, during the same time period, the Money Flow Index indicator reading started falling with a negative 36-degree angle, forming a bearish divergence in the process.
As we can see, starting from May 19, 2017, the GBPUSD price action started mimicking the Money Flow Index’s direction and the price of the Forex pair started falling as well.
By incorporating volume into the mathematical model, the Money Flow Index can produce very accurate trading signals in terms of overbought and oversold. Moreover, it can visually represent emerging divergence in the market very accurately. However, like any other technical indicator, it has some basic limitations.
One of the key limitations of the Money Flow Index is it can remain oversold or overbought for a prolonged period of time and may generate false signals. However, if you learn to develop a trading strategy that incorporates price action signals, the Money Flow Index can help identify an area of a potential reversal. Armed with this information, you can easily anticipate a change in the directional movement of price and can plan your trades accordingly.

external link:


We have been trading supply and demand strategies for over ten years, and they have stood the test of time remarkably well. Supply and demand is...

3 min read
Choosing the right trading journal is essential for traders wanting to analyze performance, refine strategies, and improve consistency. In this...

3 min read
“95% of all traders fail” is the most commonly used trading related statistic around the internet. But no research paper exists that proves this...