3 min read
A Year with "The Trading Mindwheel": Transforming Trading Through Psychology
The following is a guest post from Michael Lamothe.
I'm Michael Lamothe, and today marks an extraordinary milestone: the first anniversary of "The...
The Overbought and Oversold myth of using those concepts to trade reversals is probably one of the most widely misunderstood things in trading. Well, it is not just misunderstood but it is plain and simple wrong.
When an indicator is in Overbought and Oversold, it has absolutely nothing to do with a market getting ready for a reversal – not even in the slightest way. Any trader who tells you that the trend is likely to be over because the indicator is in Overbought and Oversold has never taken the time to actually study the tools he is using.
I have shown previously what it takes to really understand an indicator and I urge you to take a moment or two to go through my indicator guides about the STOCHASTIC, the MACD or the RSI. Those guides show that it does not take much to use an indicator in the right way, but you really must understand the tools you are using.
When an indicator is in the Overbought and Oversold area, it only has one meaning: the current trend is extremely strong. That’s truly it and there is nothing more to it.
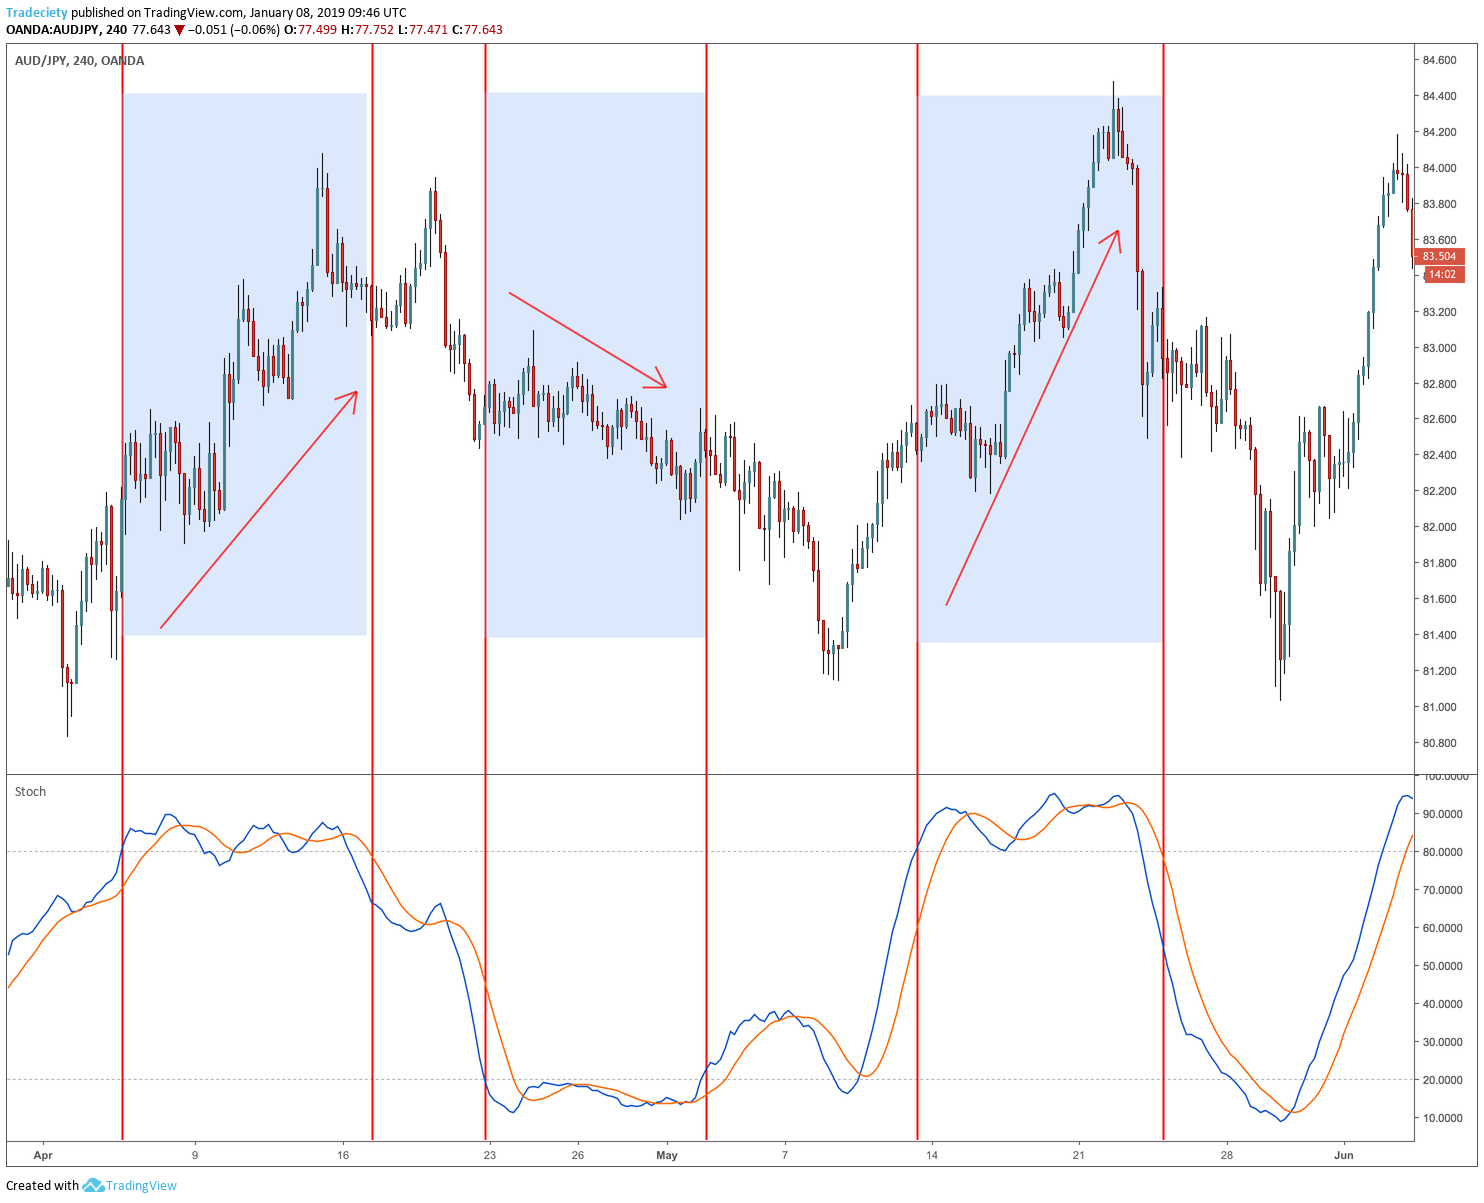
In the case of the STOCHASTIC, it means that the price has closed within a maximum of 20% of its previous range high. In case of an uptrend, this means that the price is currently pushing into new highs and the current price candles are closing near the highs when the indicator is in Overbought.
As you can see, Overbought just shows an extremely strong trend that is moving higher with a strong force.
I marked the areas when the price entered the Overbought and Oversold conditions and each time, the price kept on trending for a LONG time. By now, you will say: of course, that’s what the indicators tell us. But the majority of traders who aren’t exposed to real indicator analysis will try and keep going against the Overbought and Oversold criteria.
A trend can and will keep going for many hundreds of pips even though the price is in Overbought and Oversold territory. Going against Overbought and Oversold will certainly result in a margin call.
If anything, use Overbought and Oversold as an additional trend continuation signal.
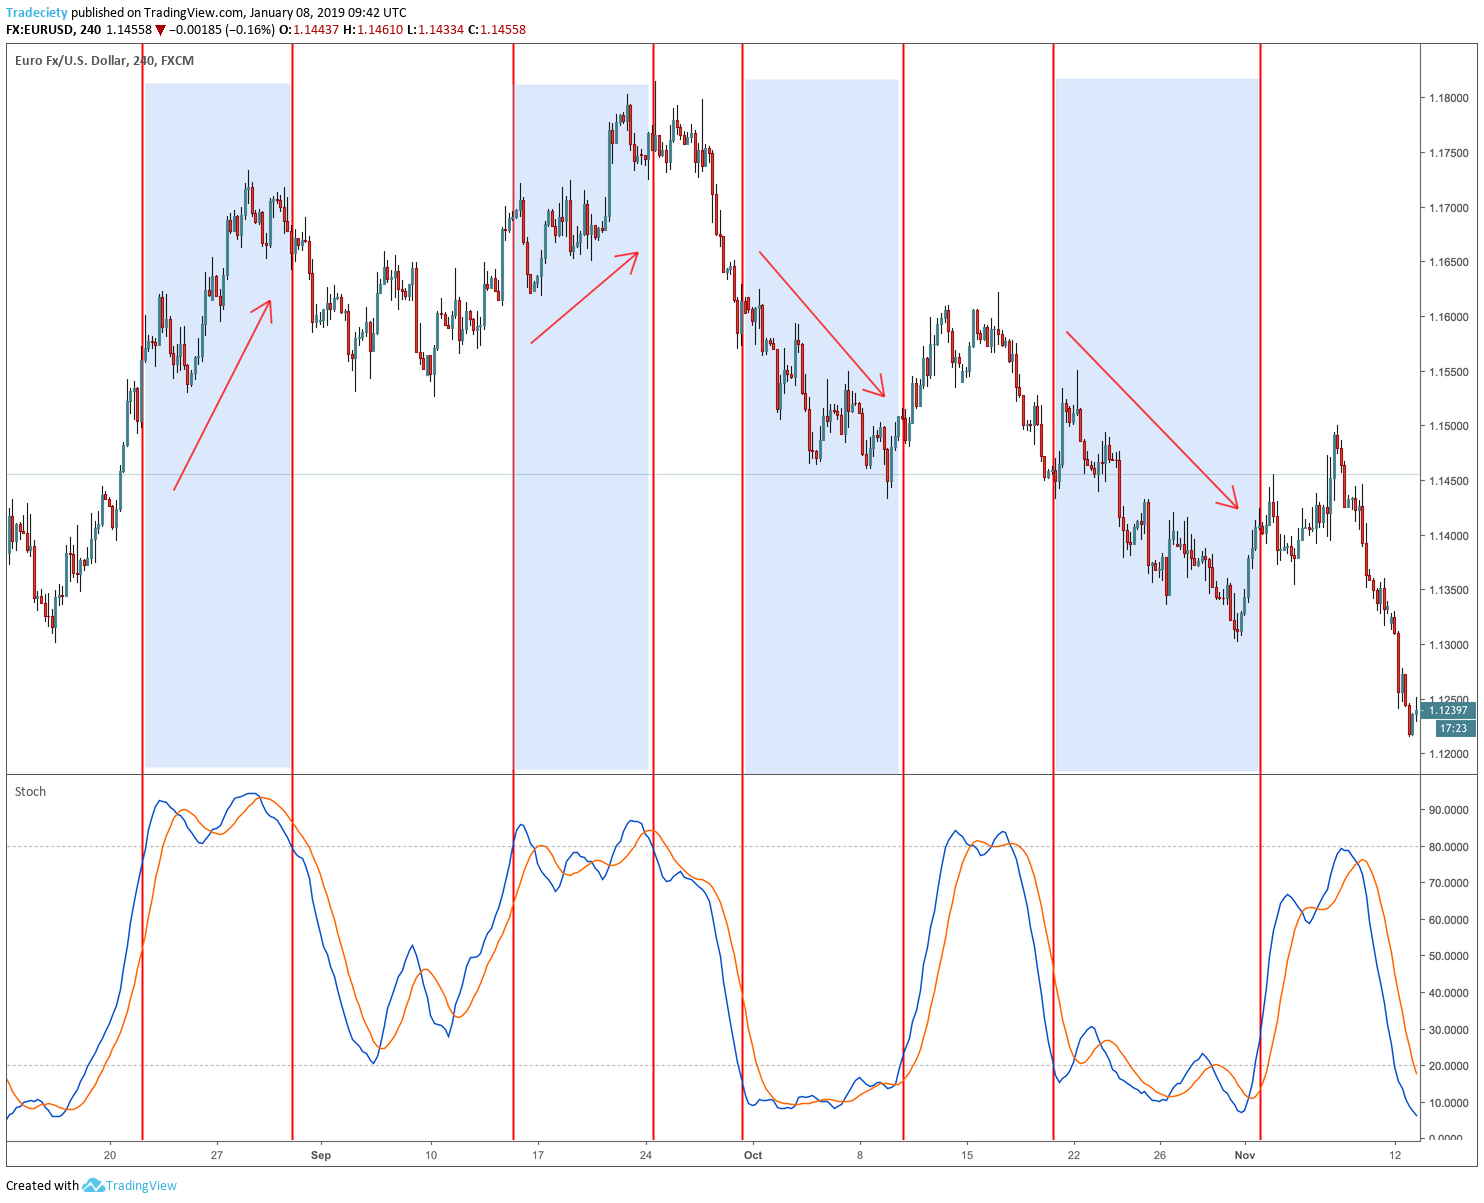
Another example that highlights why going against Overbought and Oversold is a losing strategy. In each instance, the trend kept going. Often, the Overbought and Oversold signal is just the starting point of a strong trend. When the indicators shifts from Oversold to Overbought, for example, it shows that the price structure has shifted and whereas the price previously closed near the lows, it is not pushing higher strongly.
And, as the chart study shows, even when the indicator leaves Overbought and Oversold, it is no guarantee that the trend is over. The middle example shows this nicely and even though the STOCHASTIC wasn’t in Oversold anymore, the price kept moving lower.

The chart below shows a real-world example of a current Gold chart. The price has advanced for hundreds of points over the course of the chart snippet.
Especially the last part shows how dangerous it can be to go against the Overbought condition. The indicator can stay much longer in Overbought than you can stay solvent with your trading account.

And I have a new bonus price action video for you as well:


external link:
external link:

3 min read
The following is a guest post from Michael Lamothe.
I'm Michael Lamothe, and today marks an extraordinary milestone: the first anniversary of "The...
3 min read
It's easy to get discouraged by losses and question your every move. But what if there was a way to track your progress, learn from mistakes, and...

8 min read
Dive deep into the world of finance and high-stakes trading with this selection of movies and documentaries! From the exhilarating thrill of...