3 min read
A Year with "The Trading Mindwheel": Transforming Trading Through Psychology
The following is a guest post from Michael Lamothe.
I'm Michael Lamothe, and today marks an extraordinary milestone: the first anniversary of "The...
Price action and candlesticks are a powerful trading concept and even research has confirmed that some candlestick patterns have a high predictive value and can produce positive returns. Especially interesting is a research paper by Gaginalp and Laurent in which they showed that the candlestick patterns:
Three White Soldiers, Three Black Crows and Three Inside Up have a significant short-term prediction value for the course of price. 1 Their research showed that those patterns are predictive about 75% of the time for most of their data sets.
Traders often mistakenly believe that the patterns themselves drive the markets. The first important thing you have to know is that you can’t treat candlesticks like blueprint templates which is what 99% of all trading websites teach you. It’s just wrong!
Only when a trader knows how to “read candlesticks“, he will be able to understand what the patterns tell him about the underlying market dynamics, the behavior of traders, and whether buyers or sellers are in control.
The trader who can follow the path of price and who knows how to interpret the thought-process of other financial players can take advantage of this knowledge and use price action to his advantage by reading his charts like a pro.
As mentioned earlier, there are a few patterns which seem to have a much greater predictive power and we will now examine two of those patterns to gain a better understanding of how to read the information provided by candlesticks and price action. Afterwards, we will take a look at the most important dynamics that allow you to understand any candlestick pattern.
Three Black Crows. The Three Black Crows pattern is a powerful bearish pattern because it nicely shows the fight between bulls and bears. Each candle opens higher than the previous close, but every time bears take over and push price back down again, making a new low each time.
The Three Black Crows pattern shows that, although bulls create a gap up, they don’t have the power to push price higher during active trading hours. Bears are in control. Often, the Three Black Crows pattern is followed by a strong sell-off once the bulls finally give up and stop pushing price higher. The Three White Soldiers is the opposite, bullish, version of the Three Black Crows.
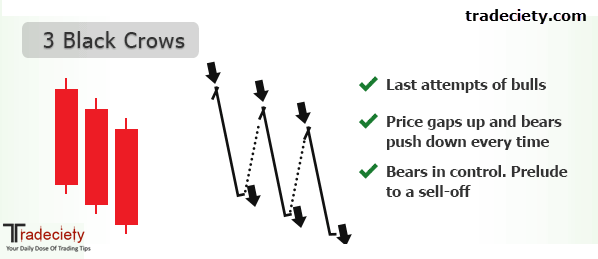
Three Black Crows bearish candlestick pattern
Three Inside Up. The Three Inside Up pattern is an extended version of the well-known Inside bar pattern. The initial bearish candle is followed by a small bullish candle and the whole second candle typically falls into the range of the previous candle. The smaller second candle shows a change in sentiment: the initial bearish price move stopped and markets consolidate. If the smaller second candle has a wick sticking out, it usually is a much stronger indicator for an upcoming shift in direction. The third candle is a larger bullish candle which breaks above the high of the first candle, finally confirming the change in direction.
The Three Inside Up pattern is a reversal pattern because it shows the slowly changing sentiment of market participants from bearish to bullish.
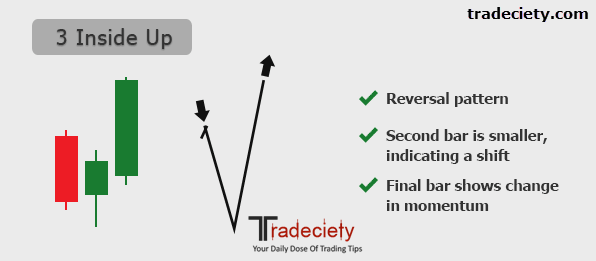
Three Inside Up reversal candlestick pattern
There are many dozens of candlestick patterns out there, but we highly discourage you from trying to remember all of them – it won’t make you a better trader. Instead, learn to read price and what the way price moves tells you about what is going on in the markets. The way we explained the thought process behind the Three Black Crows and the Three Inside Up pattern should be applied to all candlestick patterns and price action. Once you understand that it’s not about identifying exact patterns, but about knowing how to read price movements, you can analyze charts in a completely new way.
There are three main components of any candlestick pattern:
1. The size
Are candles getting larger or smaller? As seen in the example with the Three Inside Up pattern, the candles first become smaller (indicating a shift in sentiment and bears leaving the arena) and then become larger again when the bulls take over. When analyzing price action, always compare the size of the most recent candlesticks to get an idea of what is going on and what momentum is doing.
2. The wicks (shadows)
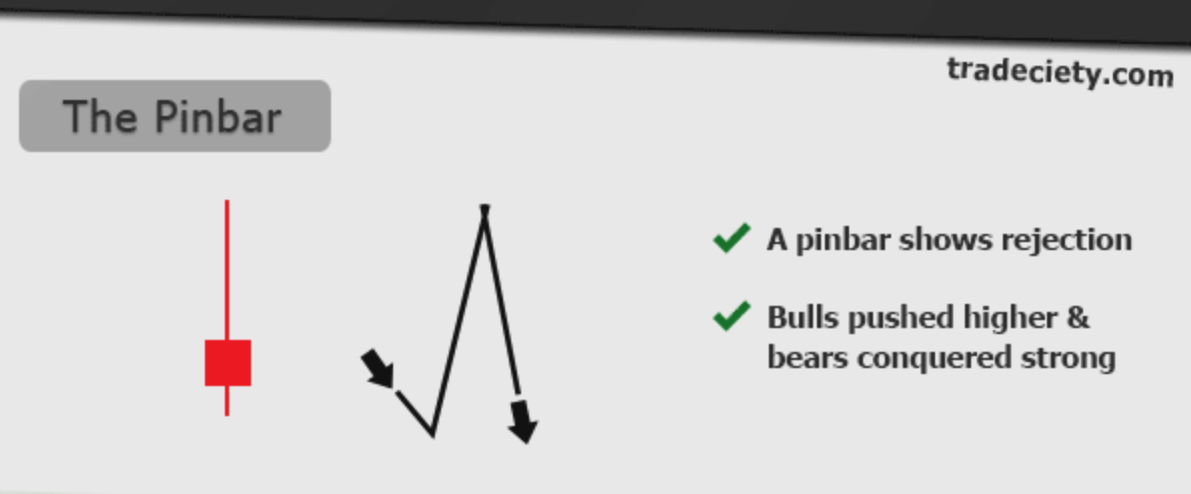
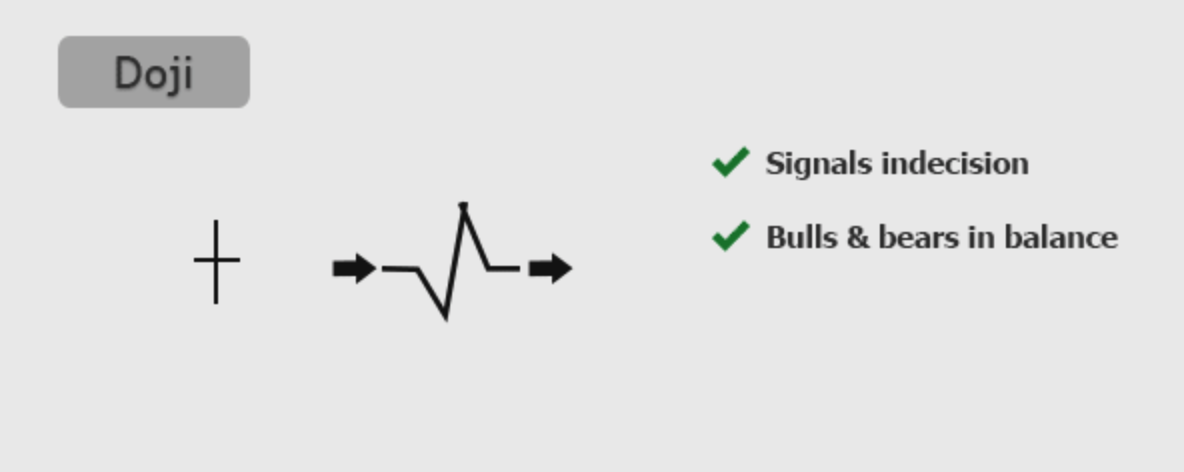
Wicks can provide a variety of different information: A wick can show the rejection of a price level like on the Pinbar pattern, but it can also show indecision in the markets like on the Doji pattern when wicks stick out to both sides and a large candle without wicks often indicates greater strength and more conviction.
3. The close
As mentioned earlier, a candle that closes near the high or low and thus does not have wicks often shows greater strength. Analyzing the close of a candle in combination with the size can provide meaningful insights about the current strength and the balance between bulls and bears. When the price is trading into important support and resistance levels, the close is also very important and it can often indicate the likelihood of levels holding or breaking.
You can apply those three concepts to all other candlestick patterns out there and you’ll very quickly realize that the only thing you need to know about candlestick patterns is those three aspects. Here is what we mean by this:
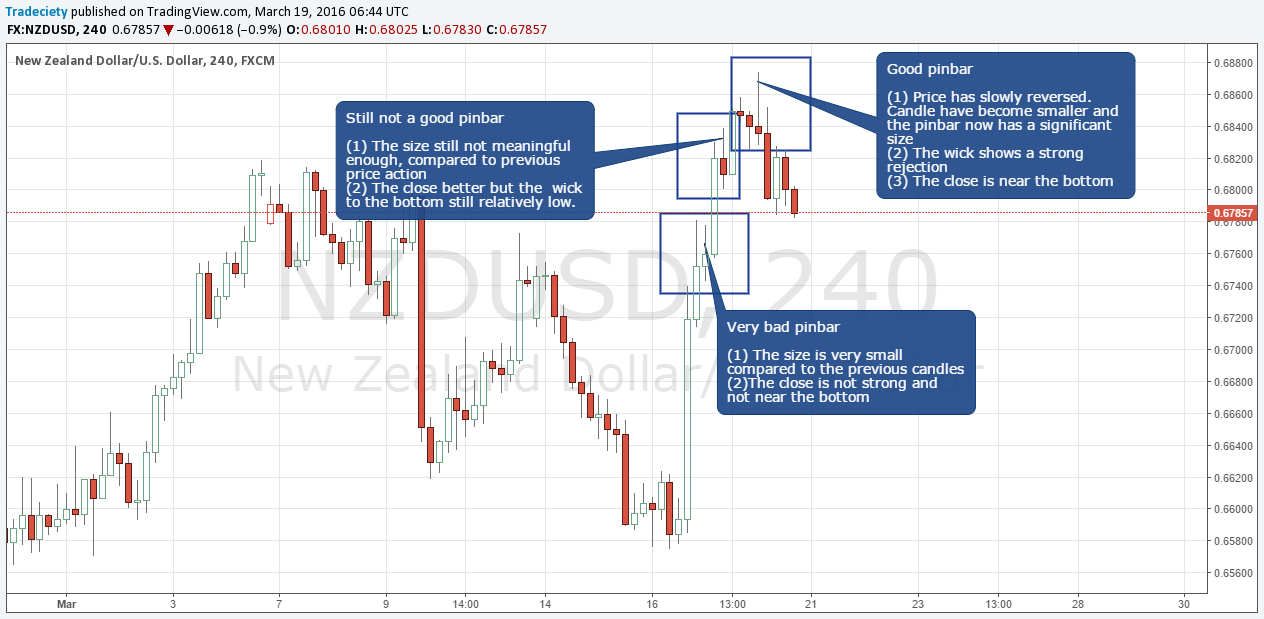
Pinbars: A meaningful pinbar is usually relatively large in comparison to prior price action. The wick should be long and stick out in the direction of the ongoing trend to show the possible shift in direction once the rejection to the downside has formed. The close should be very near the bottom in case of a bearish pinbar and only leave one rejection wick to the top, confirming the potential reversal.
Doji: A doji signals indecision and, therefore, it is usually smaller than past candlesticks. A doji typically has long wicks to both sides which further illustrates the indecision and the close is very near the middle of the candle. You can see that all three clues (size, close and wicks) point towards indecision.
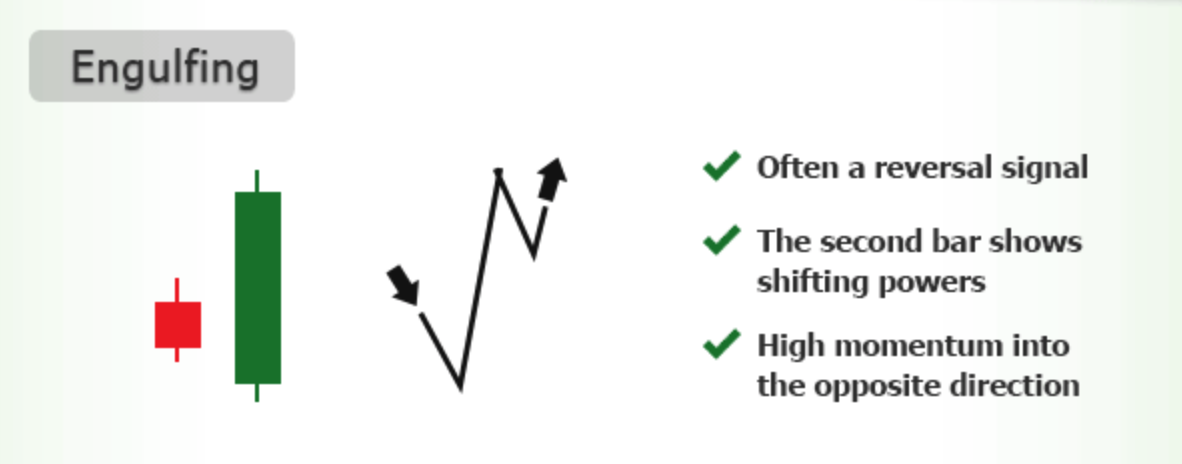
Engulfing: The engulfing pattern shows a reversal and the clues are very obvious usually. The first candle is small and indicates a temporary pause in the ongoing trend. Then, the next candle is typically much larger and the small candle completely falls into the range of the large bar. This shows that the trend pause is over and that markets have changed their mind. The large bar usually has a very strong close near the top/bottom with very small wicks, further confirming the strong trend change (see infographic below).
As you can see, every single candlestick pattern can be dissected easily by analyzing the size, the wick and the close of the candles. Thus, you can stop remembering arbitrary patterns and focus on reading the real price.
Besides understanding what a single candlestick pattern tells you, there are two additional concepts that will help you identify high probability price action signals and avoid signals that fail more often. When trading price action, it’s important to be very selective and not jump on any one signal; blueprint-thinking and looking for fixed rules should be avoided in trading in general.
1. Comparing candles
This is often a very overlooked aspect of price action trading because most traders just look for blueprint patterns and focus on individual candlesticks. However, if you want to trade price action successfully, you have to set recent price action in relation to what has happened before. A small pinbar after a trend wave with large candles is less meaningful than a larger pinbar after a trend with small candles; an engulfing candle that just barely engulfs the previous one has less predictive power than a candle that engulfs the previous one easily. Always look at your chart as a whole to put things into the right perspective.

2. Location
The concept of location means that you only trade price action signals around high probability price levels. Instead of jumping on every price action signal you see, you can significantly increase your odds by only trading around high impact support and resistance areas or supply and demand levels. Although you need to be more patient, your trading will benefit significantly as well.
And that’s all you really need to know when it comes to understanding candlestick patterns and price action trading. Don’t make it more complicated than it has to be and focus on what is really important.
And don’t forget: candlesticks are just a way to visualize price information – it’s a manifestation of crowd behavior in the markets. Candlesticks are typically not meaningful to trade them by themselves, but by combining price action with other trading concepts, you can generate a robust trading methodology.
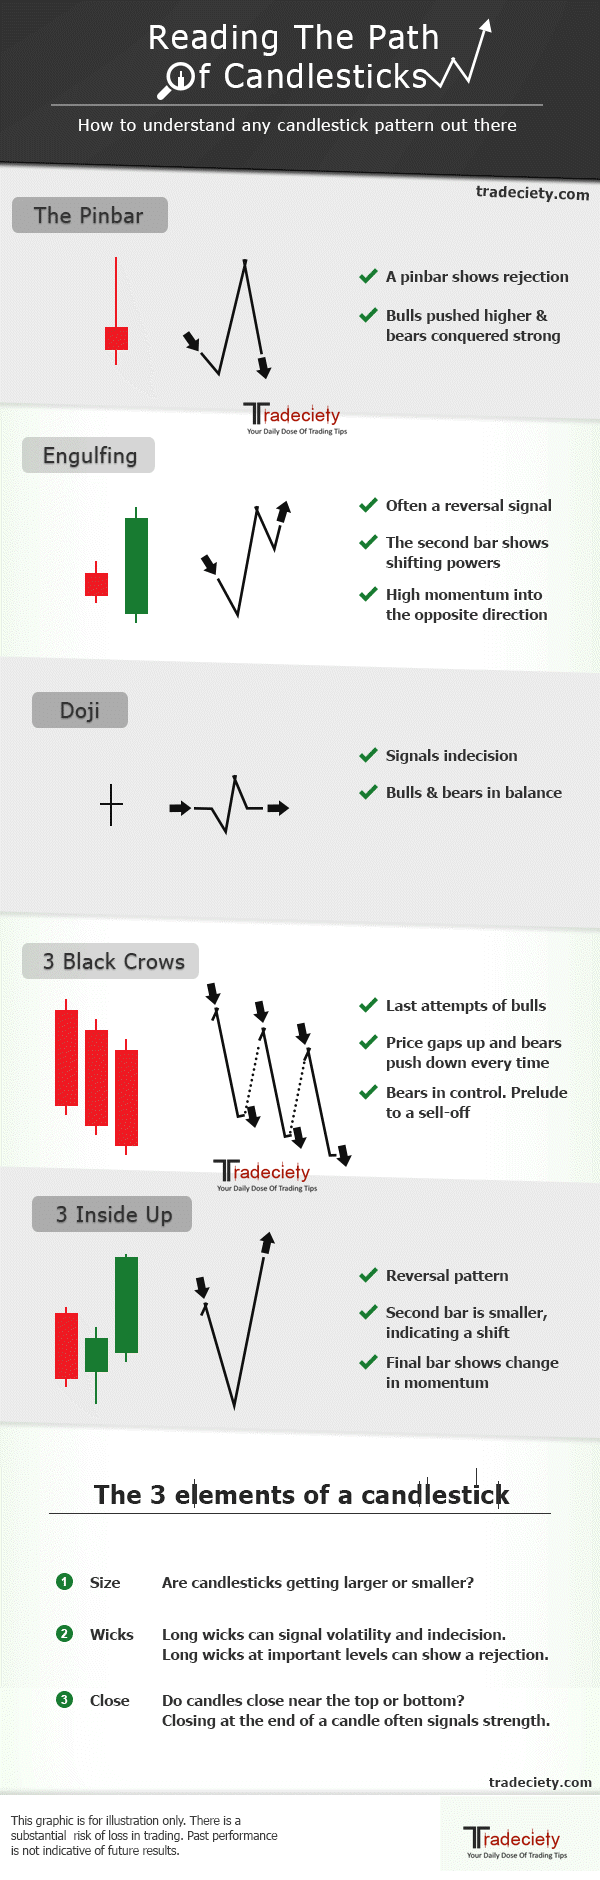
How to read candlestick patterns


external link:
external link:

3 min read
The following is a guest post from Michael Lamothe.
I'm Michael Lamothe, and today marks an extraordinary milestone: the first anniversary of "The...
3 min read
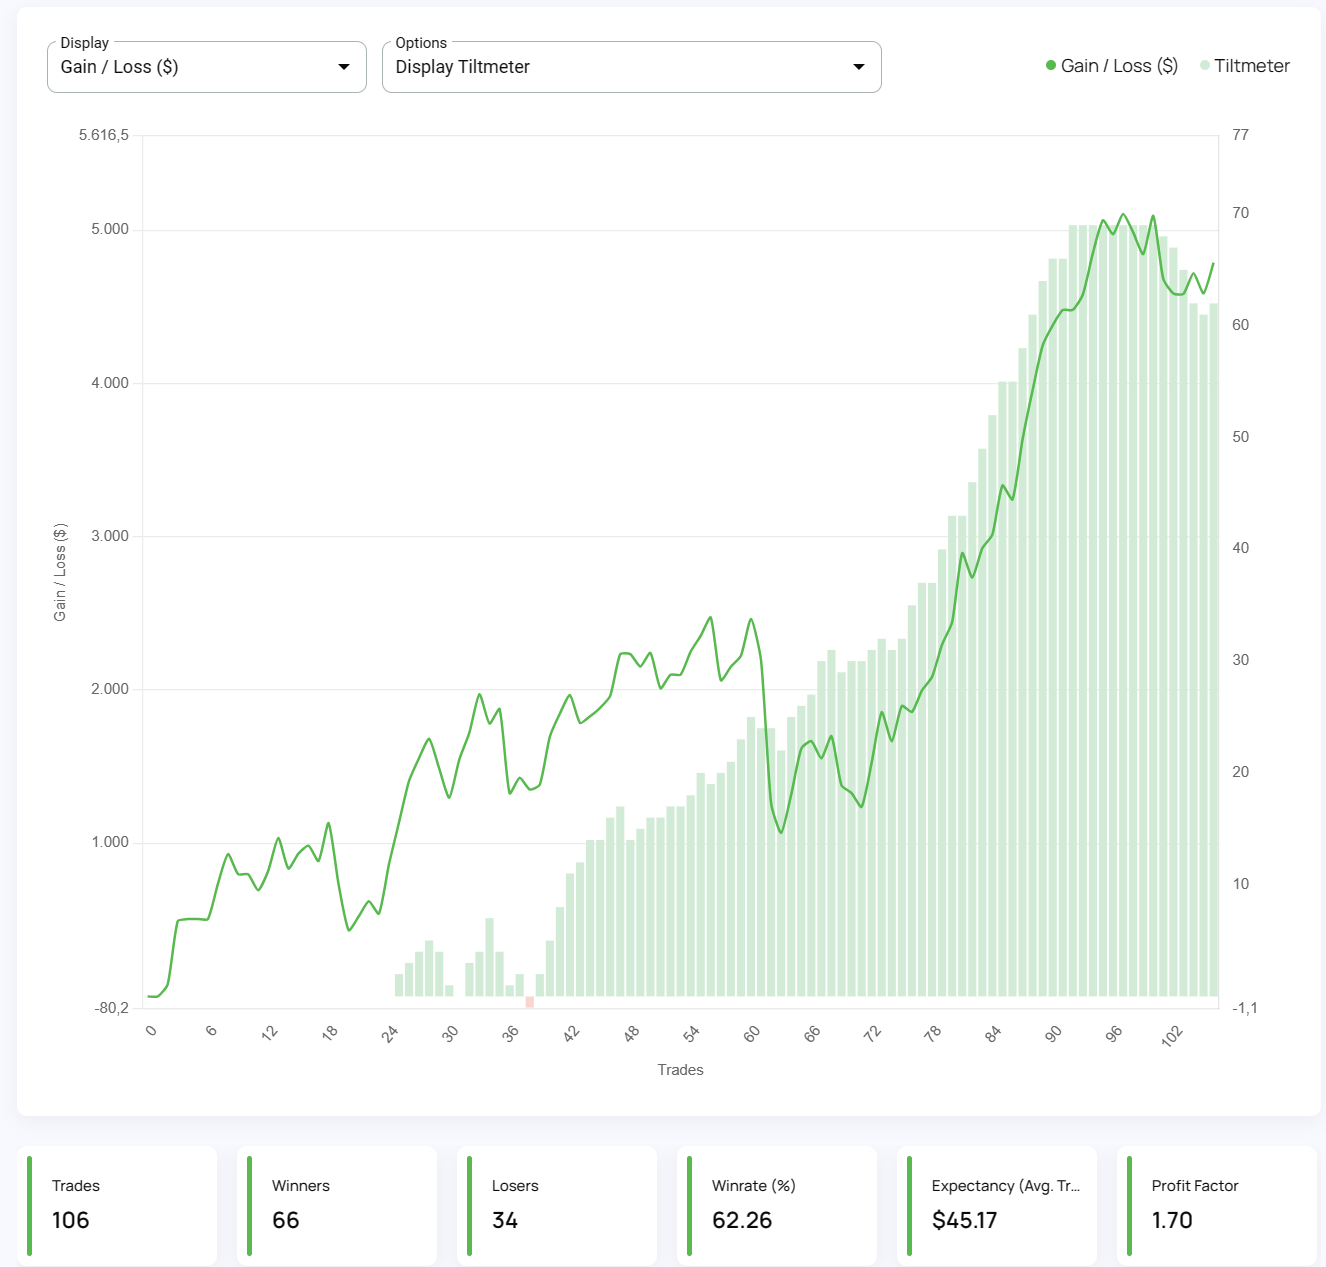
It's easy to get discouraged by losses and question your every move. But what if there was a way to track your progress, learn from mistakes, and...

8 min read
Dive deep into the world of finance and high-stakes trading with this selection of movies and documentaries! From the exhilarating thrill of...